62 Gliders & Sailplanes
Introduction
Gliders and sailplanes are names often used synonymously to refer to aircraft designed to fly without an engine. However, a sailplane is typically regarded as a high-performance glider, which can soar and remain aloft almost indefinitely by utilizing only the updrafts present in the atmosphere. A skillful pilot can soar for hours using rising air from thermals, uplifted air when the wind blows against hills and ridges, sea-breeze frontal boundaries, or high-altitude mountain waves. Flights of five or more hours covering hundreds of miles are relatively easy to accomplish in a modern sailplane, even one with modest performance. It is not unusual for sailplanes to routinely soar to altitudes of well over 20,000 ft (4,572 m), with record altitudes much higher into the stratosphere, and distances in a single flight of over 1,000 km (621 miles).
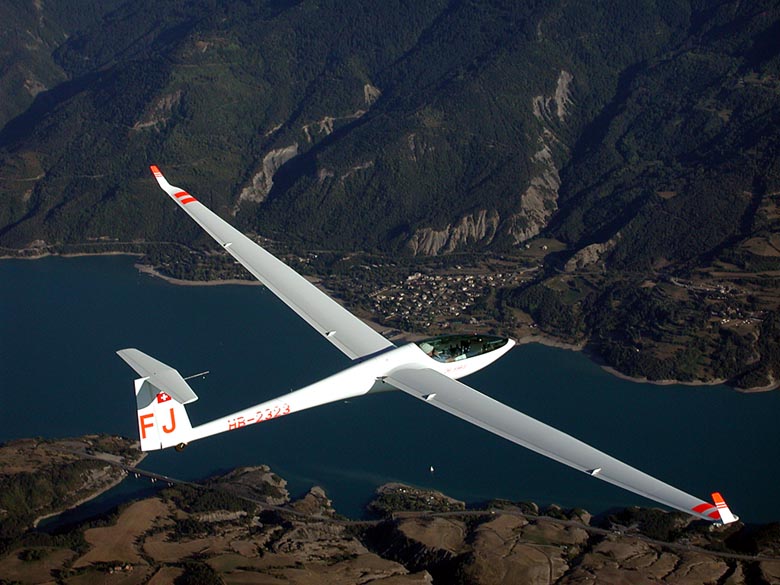
Gliders and sailplanes are designed to be lightweight and aerodynamically efficient, featuring long, high-aspect-ratio wings and sleek fuselage shapes, as illustrated in the photograph below. Some sailplanes may also use winglets, which increase the effective aspect ratio by about 10%. The pilot typically sits in a semi-prone position, allowing the fuselage to have a minimum cross-section and the lowest possible drag. Early gliders and sailplanes were primarily built of steel tubing, wood, and fabric through the 1960s, which gave them glide ratios of about 25:1. This means that for every unit of altitude lost, they would travel horizontally a distance of 25 units. Since the 1970s, most sailplanes have been constructed using composite materials such as glass and carbon fiber. These materials offer high strength, low weight, and highly smooth aerodynamic surfaces, allowing sailplanes to attain glide ratios of more than 50:1. The world’s largest single-place glider is the Nimeta X, which has a glide ratio of about 70:1.
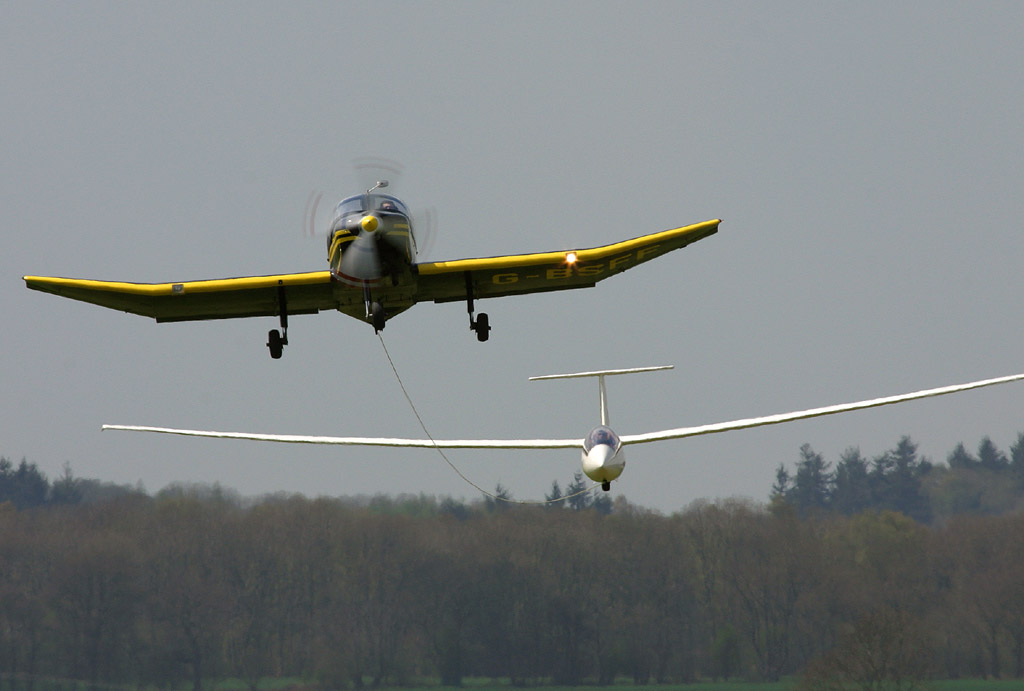
Gliders and sailplanes offer a unique and exhilarating flying experience. The first step is to launch the engineless aircraft into the air. The most common launching method is an aerotow, where a powered aircraft tows the sailplane behind it using a towline, as shown in the photograph below. Another technique is winch launching, where a ground-based winch rapidly reels in a steel cable attached to the sailplane, which climbs quickly to about 1,000 ft (300 m) before releasing the cable. Some sailplanes are self-launching and feature a small engine driving a propeller, allowing them to take off under their own power. The engine is then retracted after a safe altitude is reached.
Sailplanes are primarily flown for recreation by pilots who enjoy the pure experience of flying without power and the challenges of reading the weather and using the dynamics of the atmosphere. Impressive flights are possible, using only wind currents to stay aloft. Gliding has become a popular sport worldwide, with various competitions held at both national and international levels. These competitions involve flying specific distance courses, achieving the longest flight distance, or staying aloft for the longest time. Other pilots also strive to meet standardized duration, altitude, and distance goals for FAI certificates or to set records in categories like altitude gain, distance flown, and speed over a given course. Why not join this experienced pilot and take a flight in a high-performance sailplane to the Matterhorn?
Learning Objectives
- Learn about the history of gliding and soaring.
- Be aware of the anatomy of sailplanes and their design requirements.
- Know about sailplane aerodynamics, including the need for a high lift-to-drag ratio and minimum sink values.
- Understand what is meant by laminar flow airfoil sections and appreciate their unique aerodynamic characteristics.
History
Ancient myths speak of humans and Gods soaring the skies on giant feathered wings, mimicking those of birds. In Greek mythology, Icarus and Daedalus attempted to escape from the labyrinth of Crete by attaching feathered wings to their arms and soaring like birds. Yet, developing a practical glider design that allowed people to fly and soar in rising air currents took many centuries. In the 18th century, the nobleman George Cayley, often referred to as the “Father of Aeronautics,” conducted extensive research on the principles of gliding flight and flew numerous model gliders to understand their stability and control characteristics. As the story goes, Cayley made his coachman hang from one of his gliders and fly it across a valley, becoming the world’s first glider pilot. After the flight, the coachman resigned his position, complaining that he had been employed to drive and not to fly.
In the late 19th century, Otto Lilienthal, a German aviation pioneer, conducted many flights with his gliders, studying aerodynamics and flight characteristics. Lilienthal controlled his gliders by kinesthetics, i.e., changing the center of gravity by shifting his body, much like what is done on hang gliders. They were woefully unstable contraptions with tail surfaces that severely fluttered, which is evident from recent reenactments of his flights. Lilienthal documented his observations in a book published in 1889, “Birdflight As the Basis of Aviation: A Contribution Towards a System of Aviation,” which was to inspire and influence others who would advance the field, including Percy Pilcher in Britain and the Wright brothers in the U.S.
A budding young engineer, Percy Pilcher was a lecturer at the University of Glasgow, and his interest in aviation soon made him a pioneer aviator in his own right. After Cayley, both Lilienthal and Pilcher were the foremost experimenters with gliders at the end of the nineteenth century. Lilienthal’s infatuation with replicating the wings of birds and using weight shifting for flight control was his downfall, and he was killed in a crash in 1896. By this time, Percy Pilcher had made repeated flights with his gliders, one flight being recorded. By 1899, Pilcher had constructed a motor-driven triplane, but shortly before its first flight, he was also killed in a crash of one of his gliders.
The Wright brothers had experimented extensively with gliders, flying several variations between 1900 and 1902 and refining their understanding of flight before adding an engine. They focused on gliders initially because they believed, like Lilienthal and Pilcher, that it was essential to master the fundamental principles of aerodynamics, control, and stability before attempting powered flight. However, unlike Lilienthal and Pilcher’s use of bird and bat wing shapes, the Wrights performed their wind tunnel tests and developed wing shapes of high span and slenderness (known as aspect ratio). They also realized that weight-shifting was inadequate, so they created a three-axis control system, including wing warping for roll control, a tail or forward canard for pitch control, and a rudder for yaw control, as shown in the photograph below.
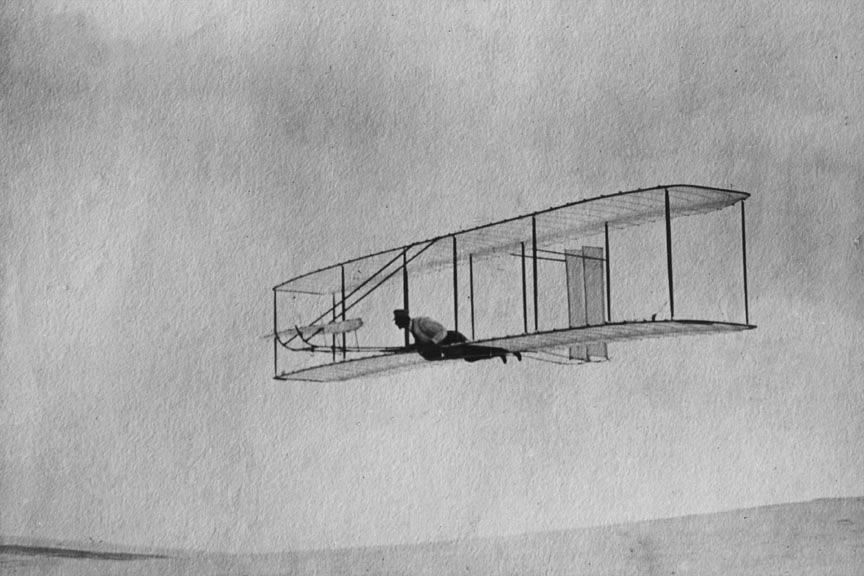
The Wright brothers soon refined their understanding of lift, drag, and the importance of balance and control. They employed three-axis aerodynamic control, rather than weight shifting, which allowed the aircraft to pitch, roll, and yaw in flight using movable aerodynamic surfaces. This concept was then applied to their powered aircraft, and they quickly obtained success with their “Flier” in December 1903.
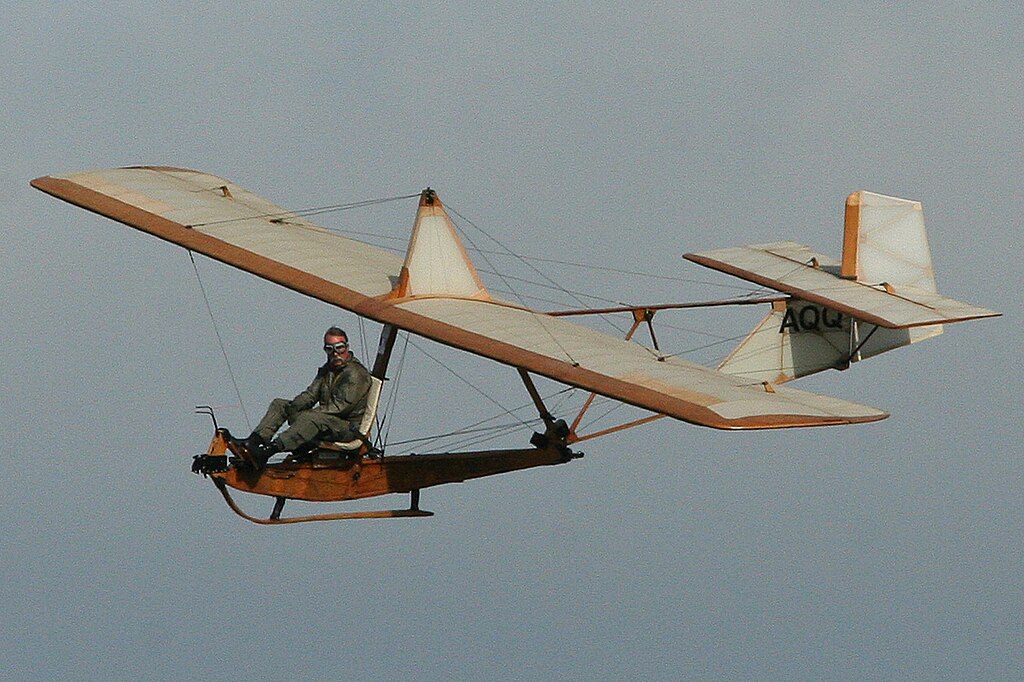
Glider development continued in the early 20th century, driven by aviation enthusiasts in Germany, Great Britain, and the United States. Following the end of WWI, interest in glider flying surged. Countries restricted by treaty limitations on developing powered aircraft then focused on gliders. Gliding clubs were established, and advancements were made in understanding aerodynamics, wing design, and launching methods. Simple, open-cockpit designs became popular and could be launched easily from a hill using a tensioned bungee. As shown in the photograph below, the minimalist Elliotts EoN open-cockpit glider of 1948 was a British copy of the German SG 38 Schulgleiter, consisting of an open-truss framework with a cable-braced wing.
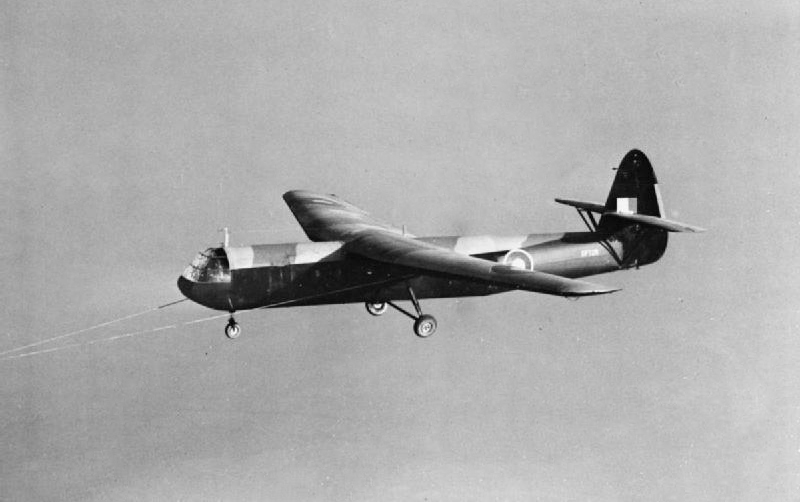
Gliders played an important role in the military operations of the Allies during WWII. Large gliders were used for transporting troops and equipment, such as the British Airspeed AS.51 Horsa and the American Waco CG-4A. The Horsa was initially designed to transport 30 fully-equipped paratroopers or carry various combinations of troops and equipment, including vehicles. The Horsa glider was primarily made of wood to conserve limited aluminum supplies for the production of fighters and bombers. In contrast, the CG-4A was constructed from welded steel tubing and wooden wings. Over 4,000 Horsas and 14,000 Wacos were built, most seeing a one-way tow over the English Channel before gliding down silently to the battlefield to unload troops and supplies. The most notable use of military gliders was during the D-Day invasion on June 6, 1944.
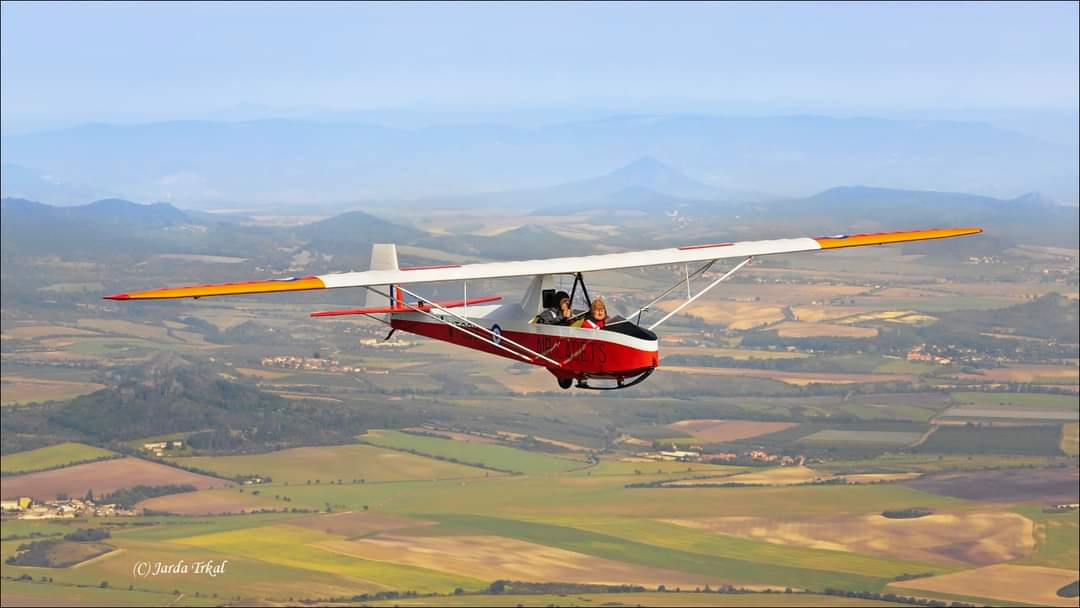
Since the 1950s, gliding has evolved into a popular sport and recreational activity worldwide. Gliders were also used for training ab initio pilots, including those from the British Royal Air Force (RAF), as seen in the photograph below of a post-WWII RAF Slingsby T-31b Cadet. While not much of a soaring machine, it was simple, robust, and reliable, and stood up to considerable abuse from ham-fisted student pilots doing “circuits and bumps.” Thousands of future pilots learned to fly in such primary gliders, many of whom transitioned to fly in the RAF or the airlines. Others became pure gliding enthusiasts, moving on to fly increasingly high-performance sailplanes for sport and recreation.
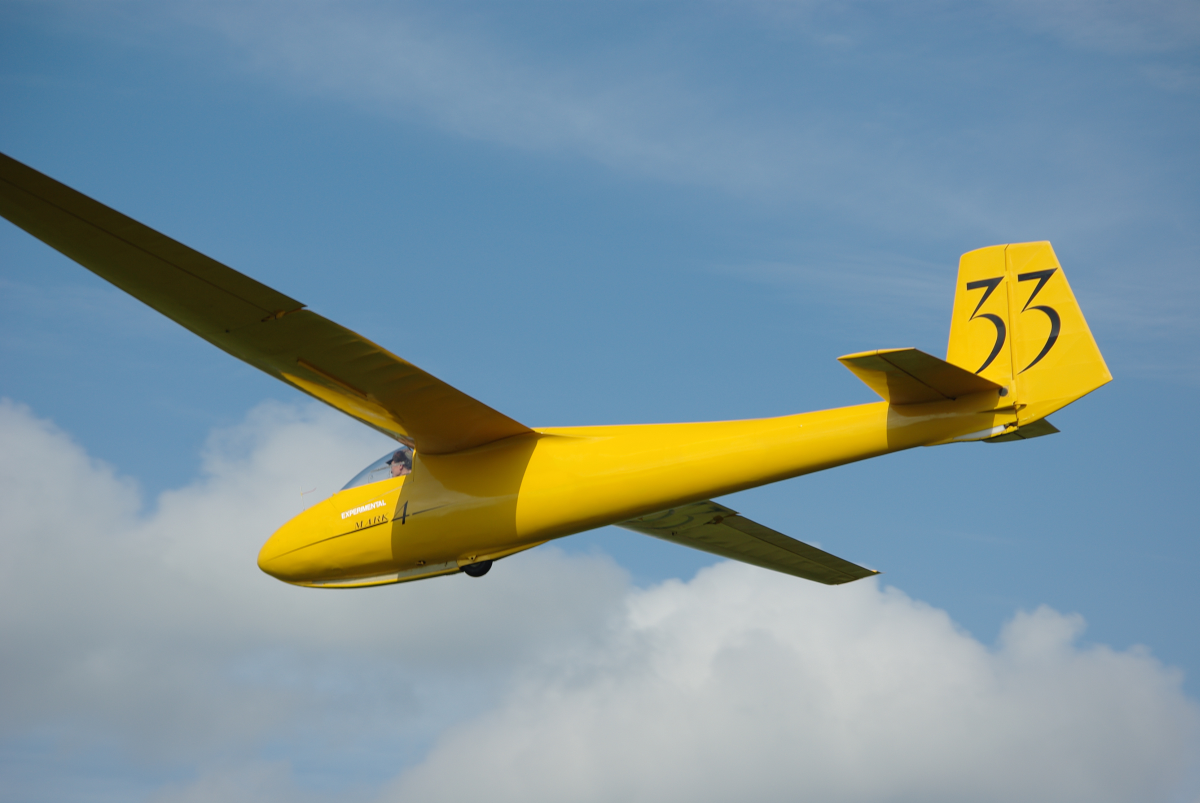
The pilots of these early sailplanes developed soaring techniques, investigated various aspects of meteorology, including thermals and high-altitude mountain waves, contributed to aeronautical research in low-speed aerodynamics and airfoil design, set numerous altitude and speed records, and provided a sport and recreational activity for subsequent generations of soaring pilots. Wooden gliders, such as the Slingsby Skylark shown in the photograph below, and the Schleicher Ka6E, represented the pinnacle of sailplane performance by the early 1960s. They had smooth laminar flow wings and glide ratios of more than 30:1, allowing them to accomplish long cross-country flights exceeding 300 km (186 nautical miles).
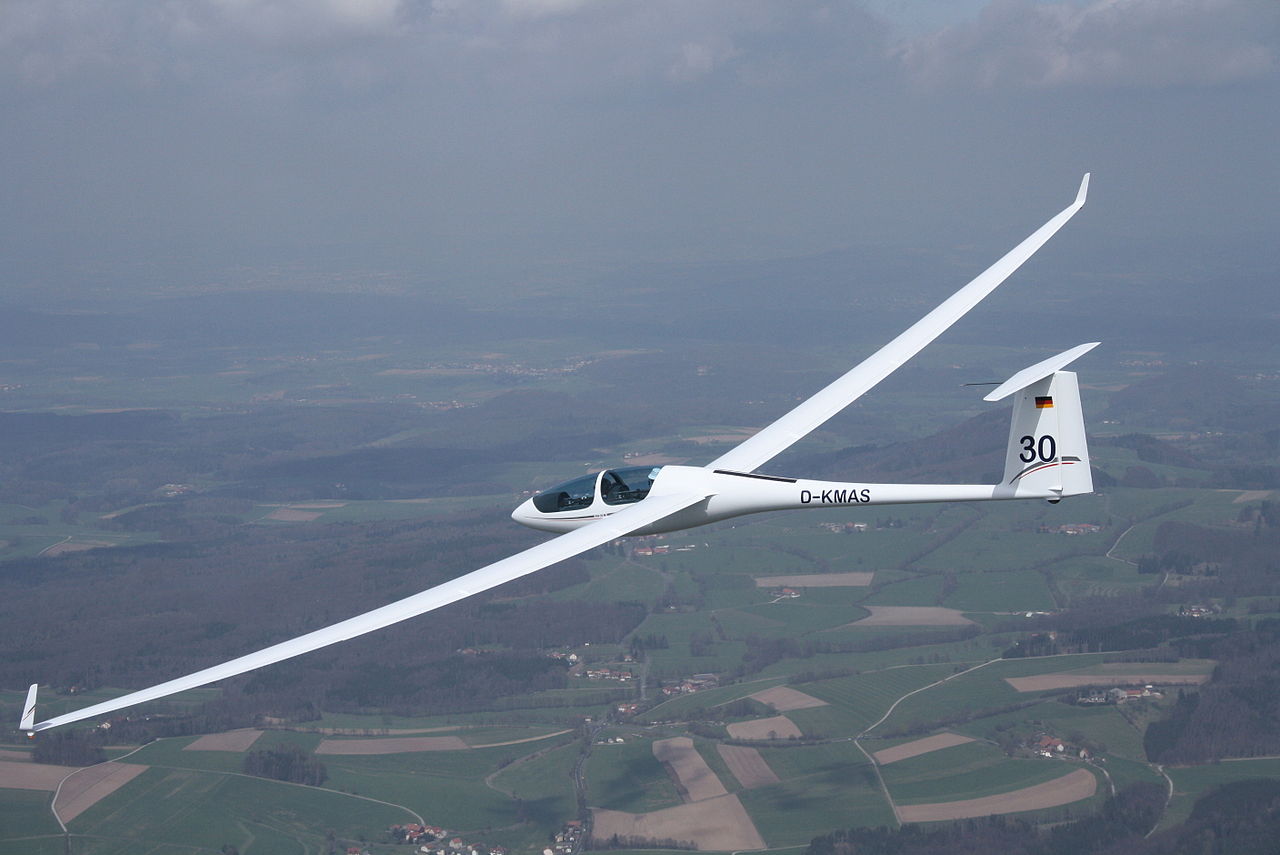
The transition from the (now!) vintage seaplanes (1970 and before) to modern sailplanes is often equated with the relatively rapid transition from predominantly wooden airframes to composite structures made of glass and carbon fiber. The technology for building composite sailplane airframes advanced rapidly in the 1980s, resulting in significant improvements in gliding and soaring performance. For example, the smooth wings increased the lift-to-drag ratio by 30% or more. In many ways, sailplane technology has led the aerospace industry in the composite manufacturing of primary airframe structures for at least two decades. Continued technological advancements have led to the development of exceedingly high-performance gliders with lift-to-drag ratios exceeding 50:1, capable of soaring over distances of 1,000 miles or more in a single flight at average speeds of over 100 knots.
Gliding continues to captivate aviation enthusiasts today, offering a unique and environmentally friendly way to experience the thrill of flight. Gliders are used for recreation, sport, research, and training, contributing to the ongoing exploration and advancement of human flight. It offers people a distinctly unique perspective of the world from the skies and is another example of humankind’s ongoing fascination with flight.
Anatomy of Sailplanes
A sailplane is a highly streamlined aircraft with a slender fuselage and long, high-aspect-ratio wings, as shown in the figure below. High aerodynamic efficiency is crucial for achieving good gliding performance, so sailplanes possess aerodynamic features not found in other aircraft. The wingspan of sailplanes can vary, but the wings are distinctively long and slender, designed to reduce induced drag and maximize gliding performance. Over the decades, the increase in wingspan and aspect ratio has been commensurate with advancements in technical design, utilizing lightweight composite structures.
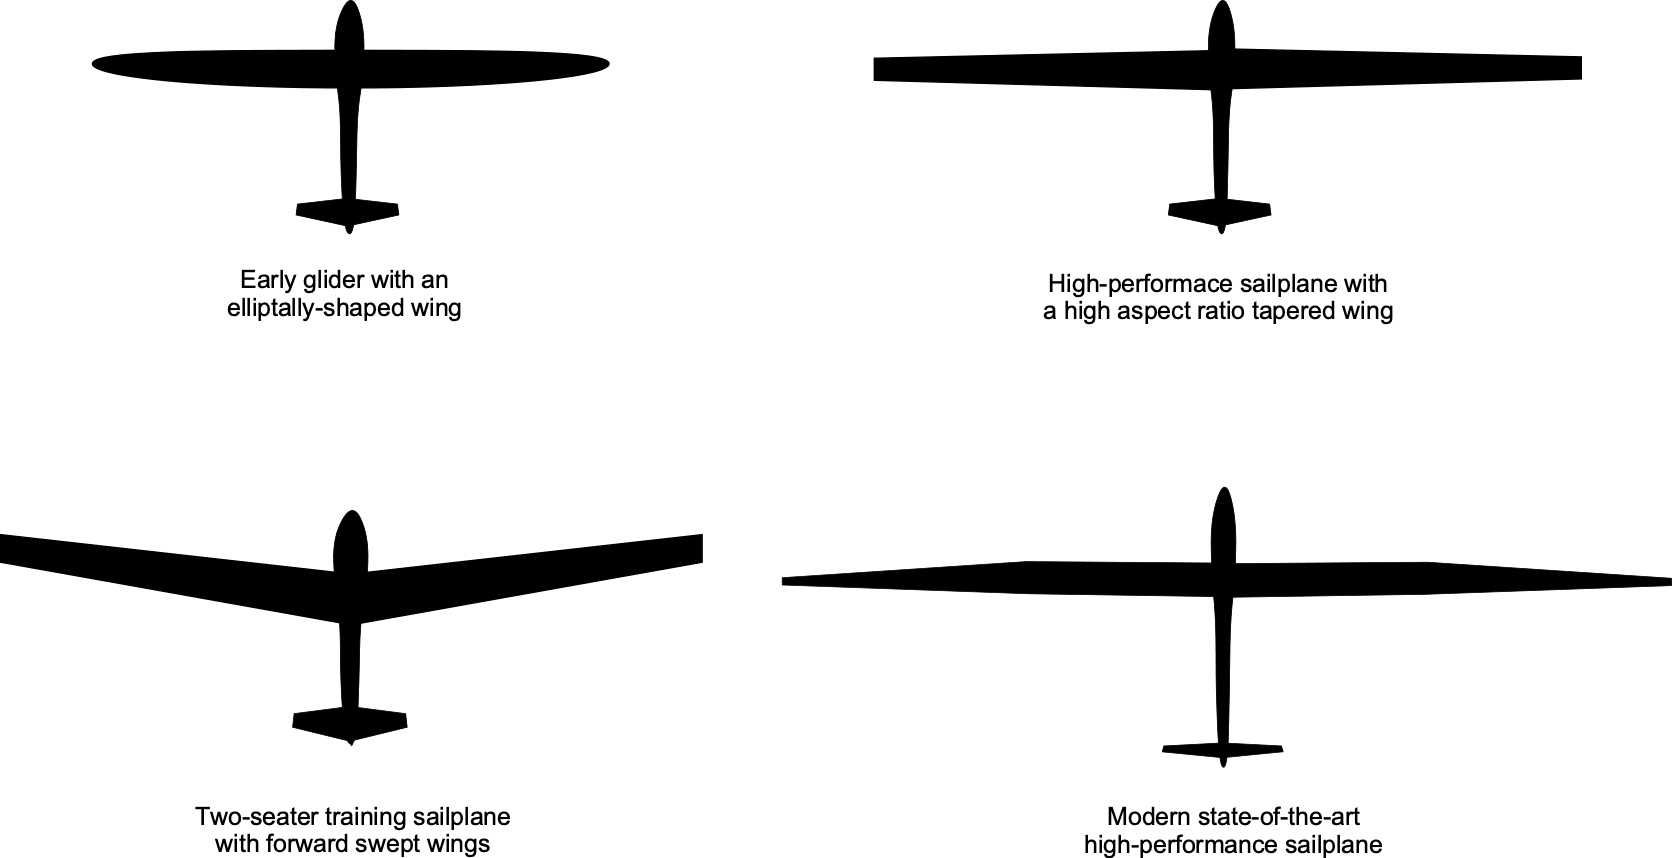
Some early gliders used elliptical wings to minimize induced drag. Still, this wing shape is time-consuming and expensive to build, and there is no significant aerodynamic advantage if the aspect ratio can be modestly larger. Many modern sailplanes feature linearly tapered wings with some washout (wing twist), resulting in very low drag and excellent aerodynamic performance. Forward-swept wings are used on some tandem two-seat sailplanes, not for aerodynamic reasons per se, but because this design feature allows the aircraft’s center of gravity to remain within limits while flying solo or in dual configuration.
As shown in the schematic below, a modern sailplane is likely to be made almost entirely of composite materials, such as glass or carbon fiber, which provides the structure with high strength and low weight. The wings utilize smooth, low-drag laminar airfoil sections, which necessitate precise geometric accuracy in their construction. The surfaces must be rendered glassy smooth through meticulous polishing. Some modern sailplanes may feature winglets at the tips of their wings to further reduce induced drag, as shown in the figure below.
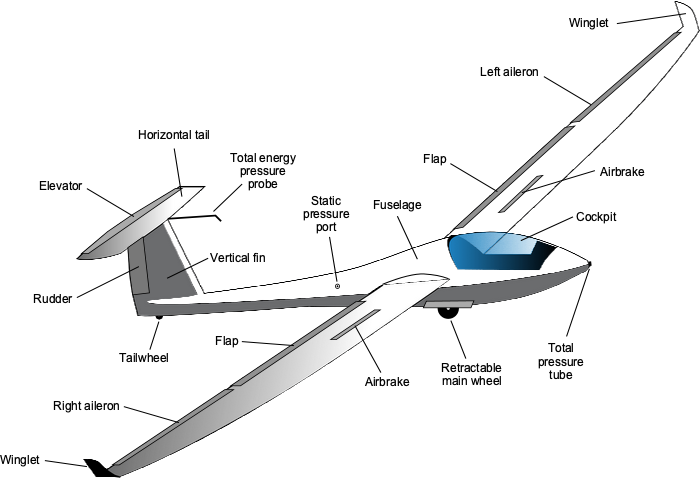
The primary control surfaces on a sailplane’s wings are the ailerons, flaps, and airbrakes. Flaps are used for launching and landing but may also be set to negative angles during flight to maximize the glide speed. The airbrakes are like spoilers and can be deployed progressively by the pilot to increase drag and steepen the glide angle, which is especially important for landing; otherwise, the sailplane will tend to “float” too far.
The empennage consists of the horizontal tail and vertical fin, which provide pitch and directional (yaw) stability, respectively. The elevator and rudder give the pilot pitch and yaw control. The hinge gaps of the ailerons, rudder, and elevator must be carefully sealed on sailplanes to minimize drag. Sailplanes may have a fixed or retractable landing gear system. A retractable landing gear can measurably reduce drag at the expense of some weight and mechanical complexity. The landing gear typically consists of a single central wheel and a tail wheel or a small, hard rubber skid.
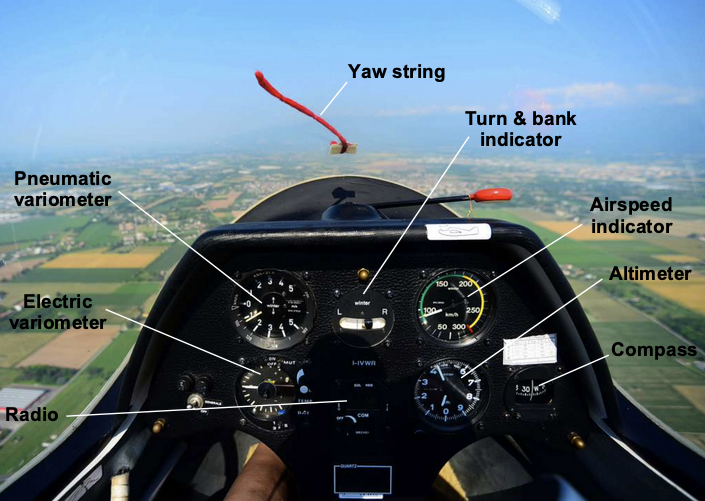
The cockpit of a sailplane is minimalistic. It includes a seat, control column, and other flight controls, such as flaps, spoilers, airbrakes, and various instruments, as shown in the photograph below. Pilots usually sit in a semi-prone position, allowing the fuselage to be slender with a minimal cross-sectional area, which results in low drag. The instrument panel will have an airspeed indicator, an altimeter, a sensitive rate of climb indicator (called a variometer), a turn and bank indicator, and a “yaw string,”[1] and other equipment, such as radios for air-to-ground and air-to-air communications and perhaps a GPS for navigation. Many sailplanes are equipped with an oxygen system for use in flights above 12,000 feet; sailplanes have flown at altitudes well into the stratosphere by utilizing the updrafts produced by mountain waves. Pilots will want to avoid wearing shorts and a T-shirt at these altitudes!
Sailplane Aerodynamics
Sailplanes glide by utilizing the effects of gravity; they soar by harnessing the upward-lifting aerodynamics of the natural atmosphere. Sailplanes are designed with smooth, streamlined shapes to minimize drag. The wings of a sailplane are typically long and slender, with a high aspect ratio, which maximizes lift and minimizes drag. The aerodynamic efficiency depends on using laminar flow airfoils for the wings, reducing surface roughness, and optimizing the fuselage shape.
Glide Ratio
Consider first a sailplane in steady, unaccelerated, gliding flight in still air, as shown in the figure below. The glide angle is denoted by  , which equals the pitch angle minus the angle of attack. The glide ratio measures how far a sailplane can travel horizontally compared to the vertical distance it descends. A high glide ratio means the glider can cover a longer distance for a given altitude loss. Sailplanes are designed to have high glide ratios, often ranging from 30:1 to 50:1 or even higher. This means the sailplane can travel 30 to 50 units horizontally for every unit of altitude lost.
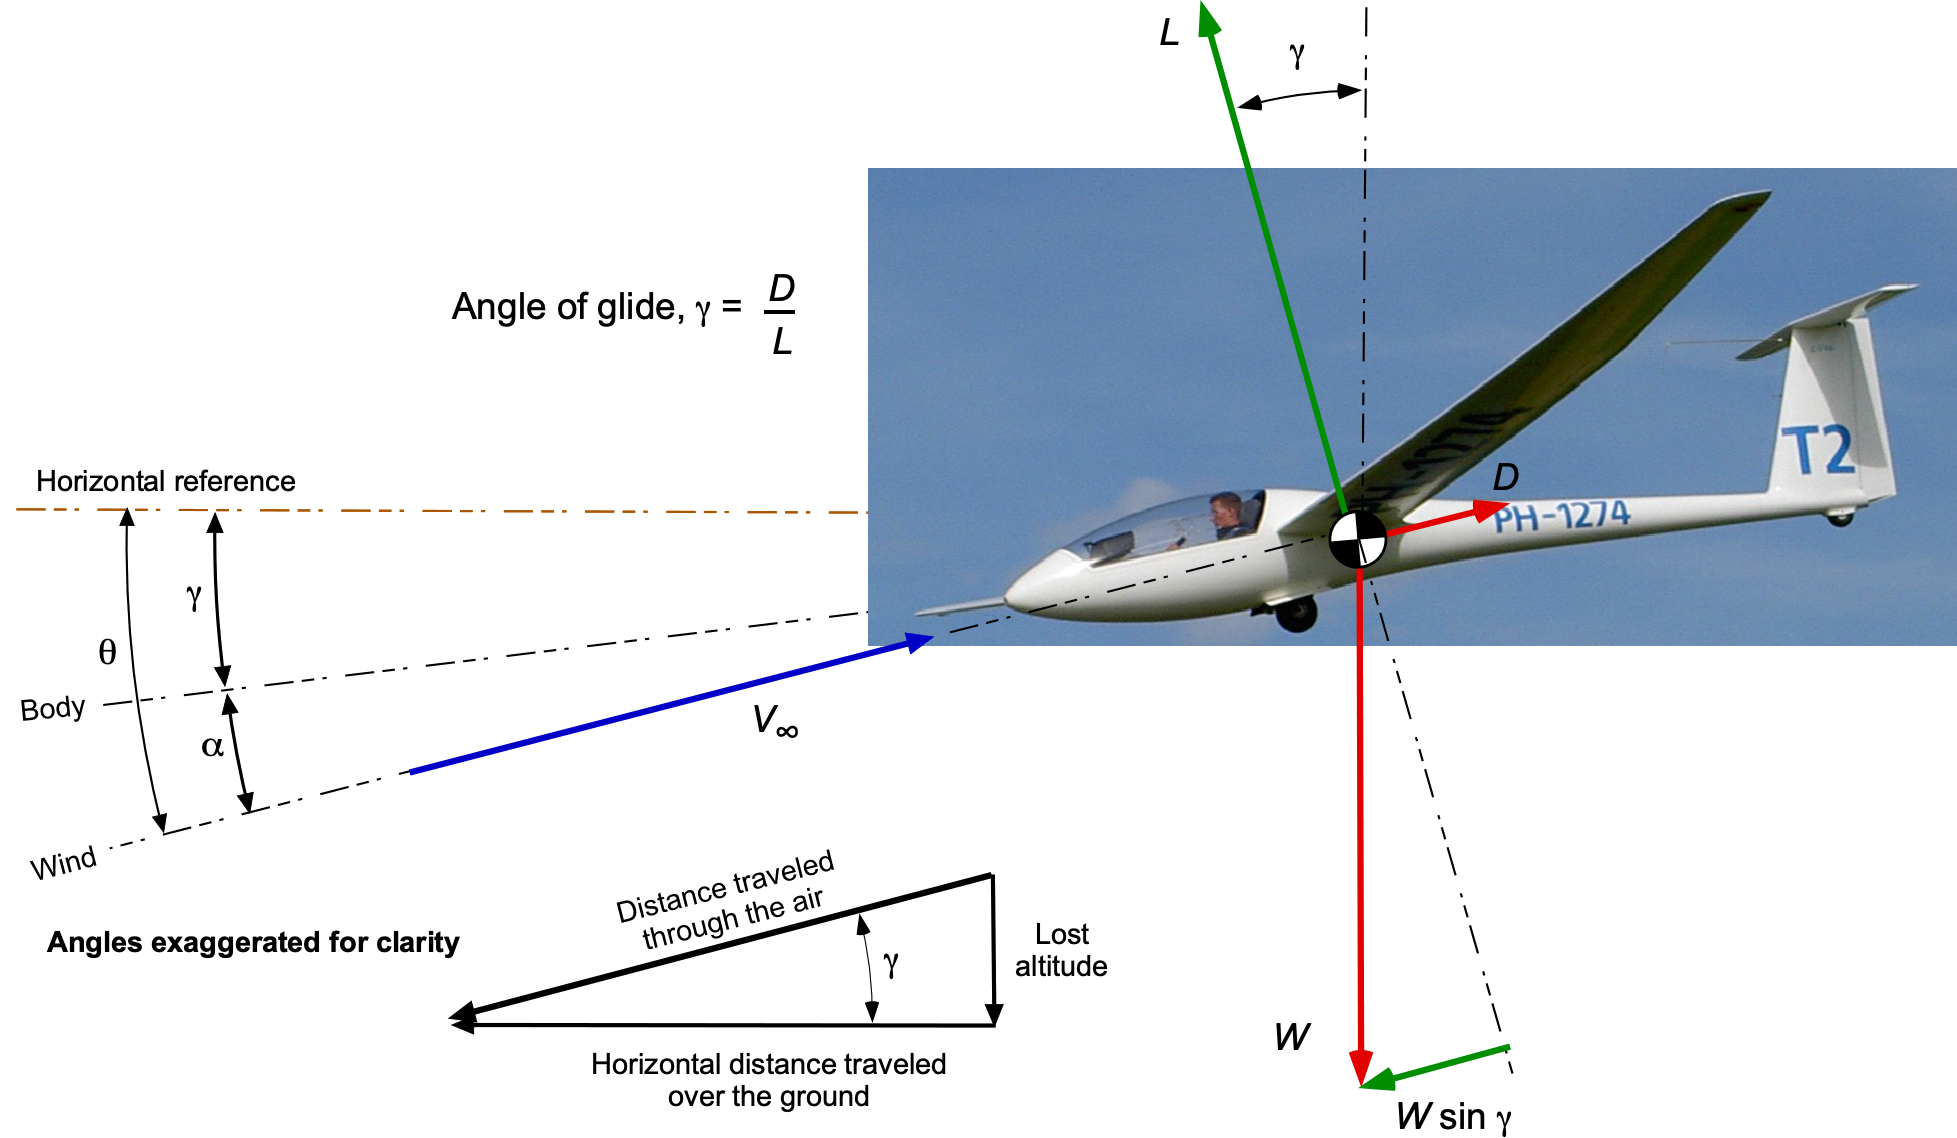
For a steady glide at a constant airspeed, the equations of motion reduce to a simple force equilibrium, i.e.,
(1) 
which shows that the weight component, i.e., the effects of gravity, balances the drag. Therefore,
(2) 
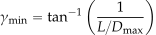
showing that the glide angle will be a function only of the sailplane’s lift-to-drag ratio  and not its weight. The higher the , the shallower the glide angle and the further the glide distance from a given height. The shallowest glide ratio will be obtained at the maximum value of , i.e.,
(3) 
The airspeed along the flight path can be decomposed into horizontal and vertical components, i.e.,  , which is directed downward, and
  , which is directed horizontally. Because the distance traveled is equal to velocity times the time in flight, then
(4) 
and the lost altitude is
(5) 
The gliding performance of the sailplane can thus be determined, such as the gliding range and flight duration.
The steady gliding range,  , from a given initial altitude,
  , is easily calculated because
(6) 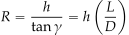
as shown in the figure below. Therefore, the higher the sailplane’s initial altitude and the better its ratio, the greater its gliding distance. Again, notice that the gliding range does not depend on the weight of the sailplane.
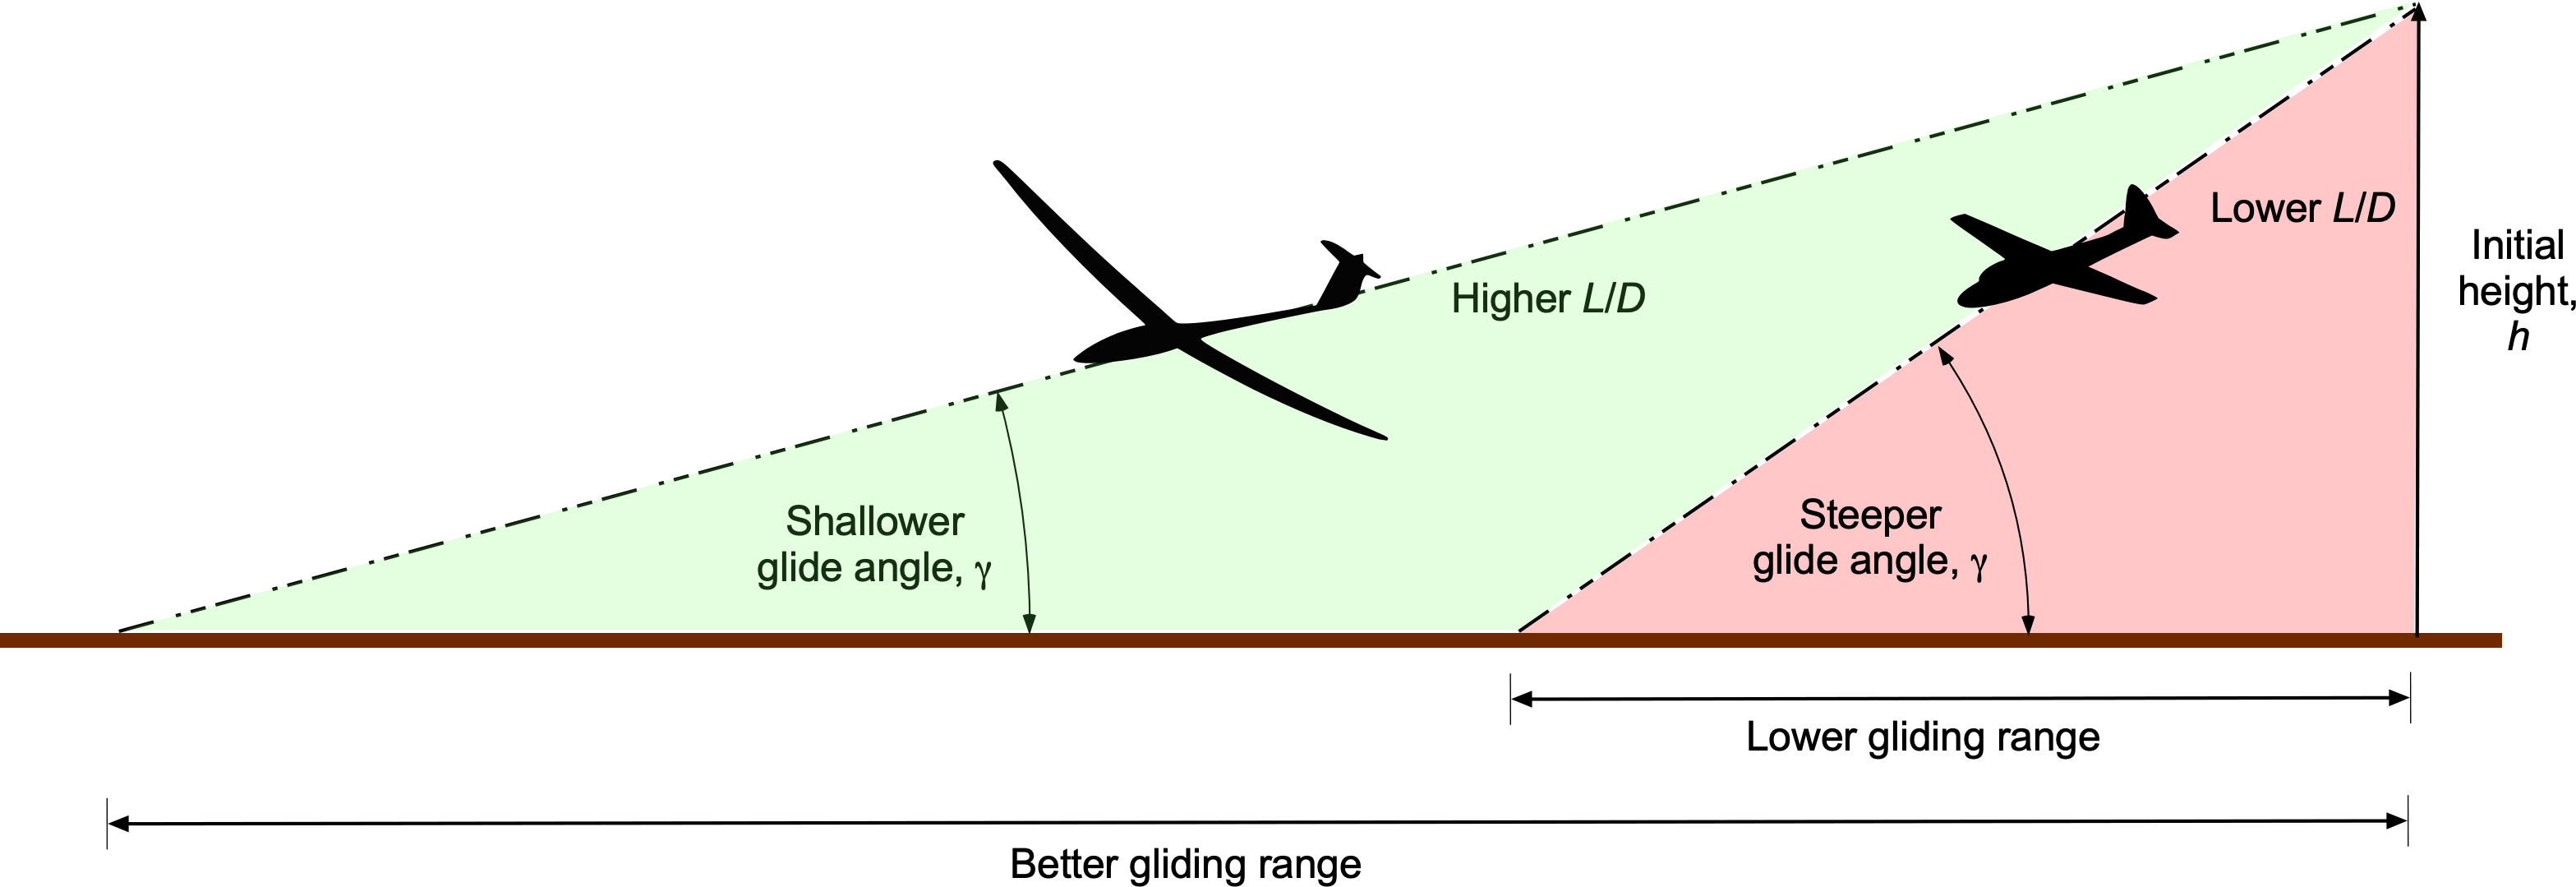 , can glide further from the same height.
Gliding Speed
Proceeding further by considering the aerodynamics in the glide gives for the lift
(7) 
A legitimate assumption, which also makes the mathematics easier, is that is small so that  . Therefore, solving for the airspeed gives
(8) 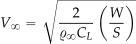
where  is the wing loading. The previous result indicates that the higher the wing loading, the higher the expected glide speed, which also depends on air density, i.e., density altitude. The glide angle remains a function of the , but a sailplane with a higher weight will glide under these conditions at a higher airspeed. This means it will cover the same distance over the ground (i.e., the gliding distance) but reach the destination sooner. Such an advantage is important in competition soaring, where time and speed are essential.
Check Your Understanding #1 – Gliding range
A sailplane pilot is at an altitude of 5,500 ft MSL and needs to glide about 55 km to an airfield at 500 ft MSL. The sailplane has a maximum lift-to-drag ratio of 40:1. Assuming still air, will the pilot be able to glide and land at the airfield without thermalling?
Show solution/hide solution.
The steady gliding range, , from a given initial altitude, , can be calculated using
![\[ R = h \left( \frac{L}{D} \right) \]](https://eaglepubs.erau.edu/app/uploads/quicklatex/quicklatex.com-d20426db8cd33dd8ac191ac04956618b_l3.svg "Rendered by QuickLaTeX.com")
So, from 5,500 ft, the gliding distance will be
![\[ R = \left( 5,500 - 500 \right) \times 40.0 = 200,000~\mbox{ft} \approx 61~\mbox{km} \]](https://eaglepubs.erau.edu/app/uploads/quicklatex/quicklatex.com-78b49e5772a5de368776514f71a1f5f5_l3.svg "Rendered by QuickLaTeX.com")
Therefore, the sailplane is high enough to reach the airfield with a good margin without having to catch any thermals.
Minimum Sink Condition
For soaring rather than gliding, the minimum sink rate condition is significant. Recall that the airspeed along the flight path can be decomposed into horizontal and vertical components, i.e., , which is downward, and , which is horizontal, where
(9) 
The drag is given by
(10) 
and so eliminating the  term gives
(11) 
Alternatively, because
(12) 
then using Eq. 8 gives
(13) 
Therefore,
(14) 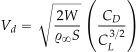
Therefore, the sink rate is proportional to the aerodynamic quantity  , so this ratio must be maximized to minimize the sink rate. This flight condition will reduce the time to descend or maximize the time aloft in still air. It will also be the condition to maximize the rate of climb in rising air during soaring, such as circling in a thermal. Interestingly, this condition is precisely what is required to maximize flight endurance in a propeller-driven airplane.
Drag Polars
Sailplane performance aerodynamics primarily involves calculating drag on the aircraft and the variation of the drag coefficient with airspeed and lift coefficient. To this end, flight test data have established the drag polars for several sailplanes, an example shown in the plot below. The process of determining these data is lengthy, which is discussed in a technical paper by Paul Bickle.
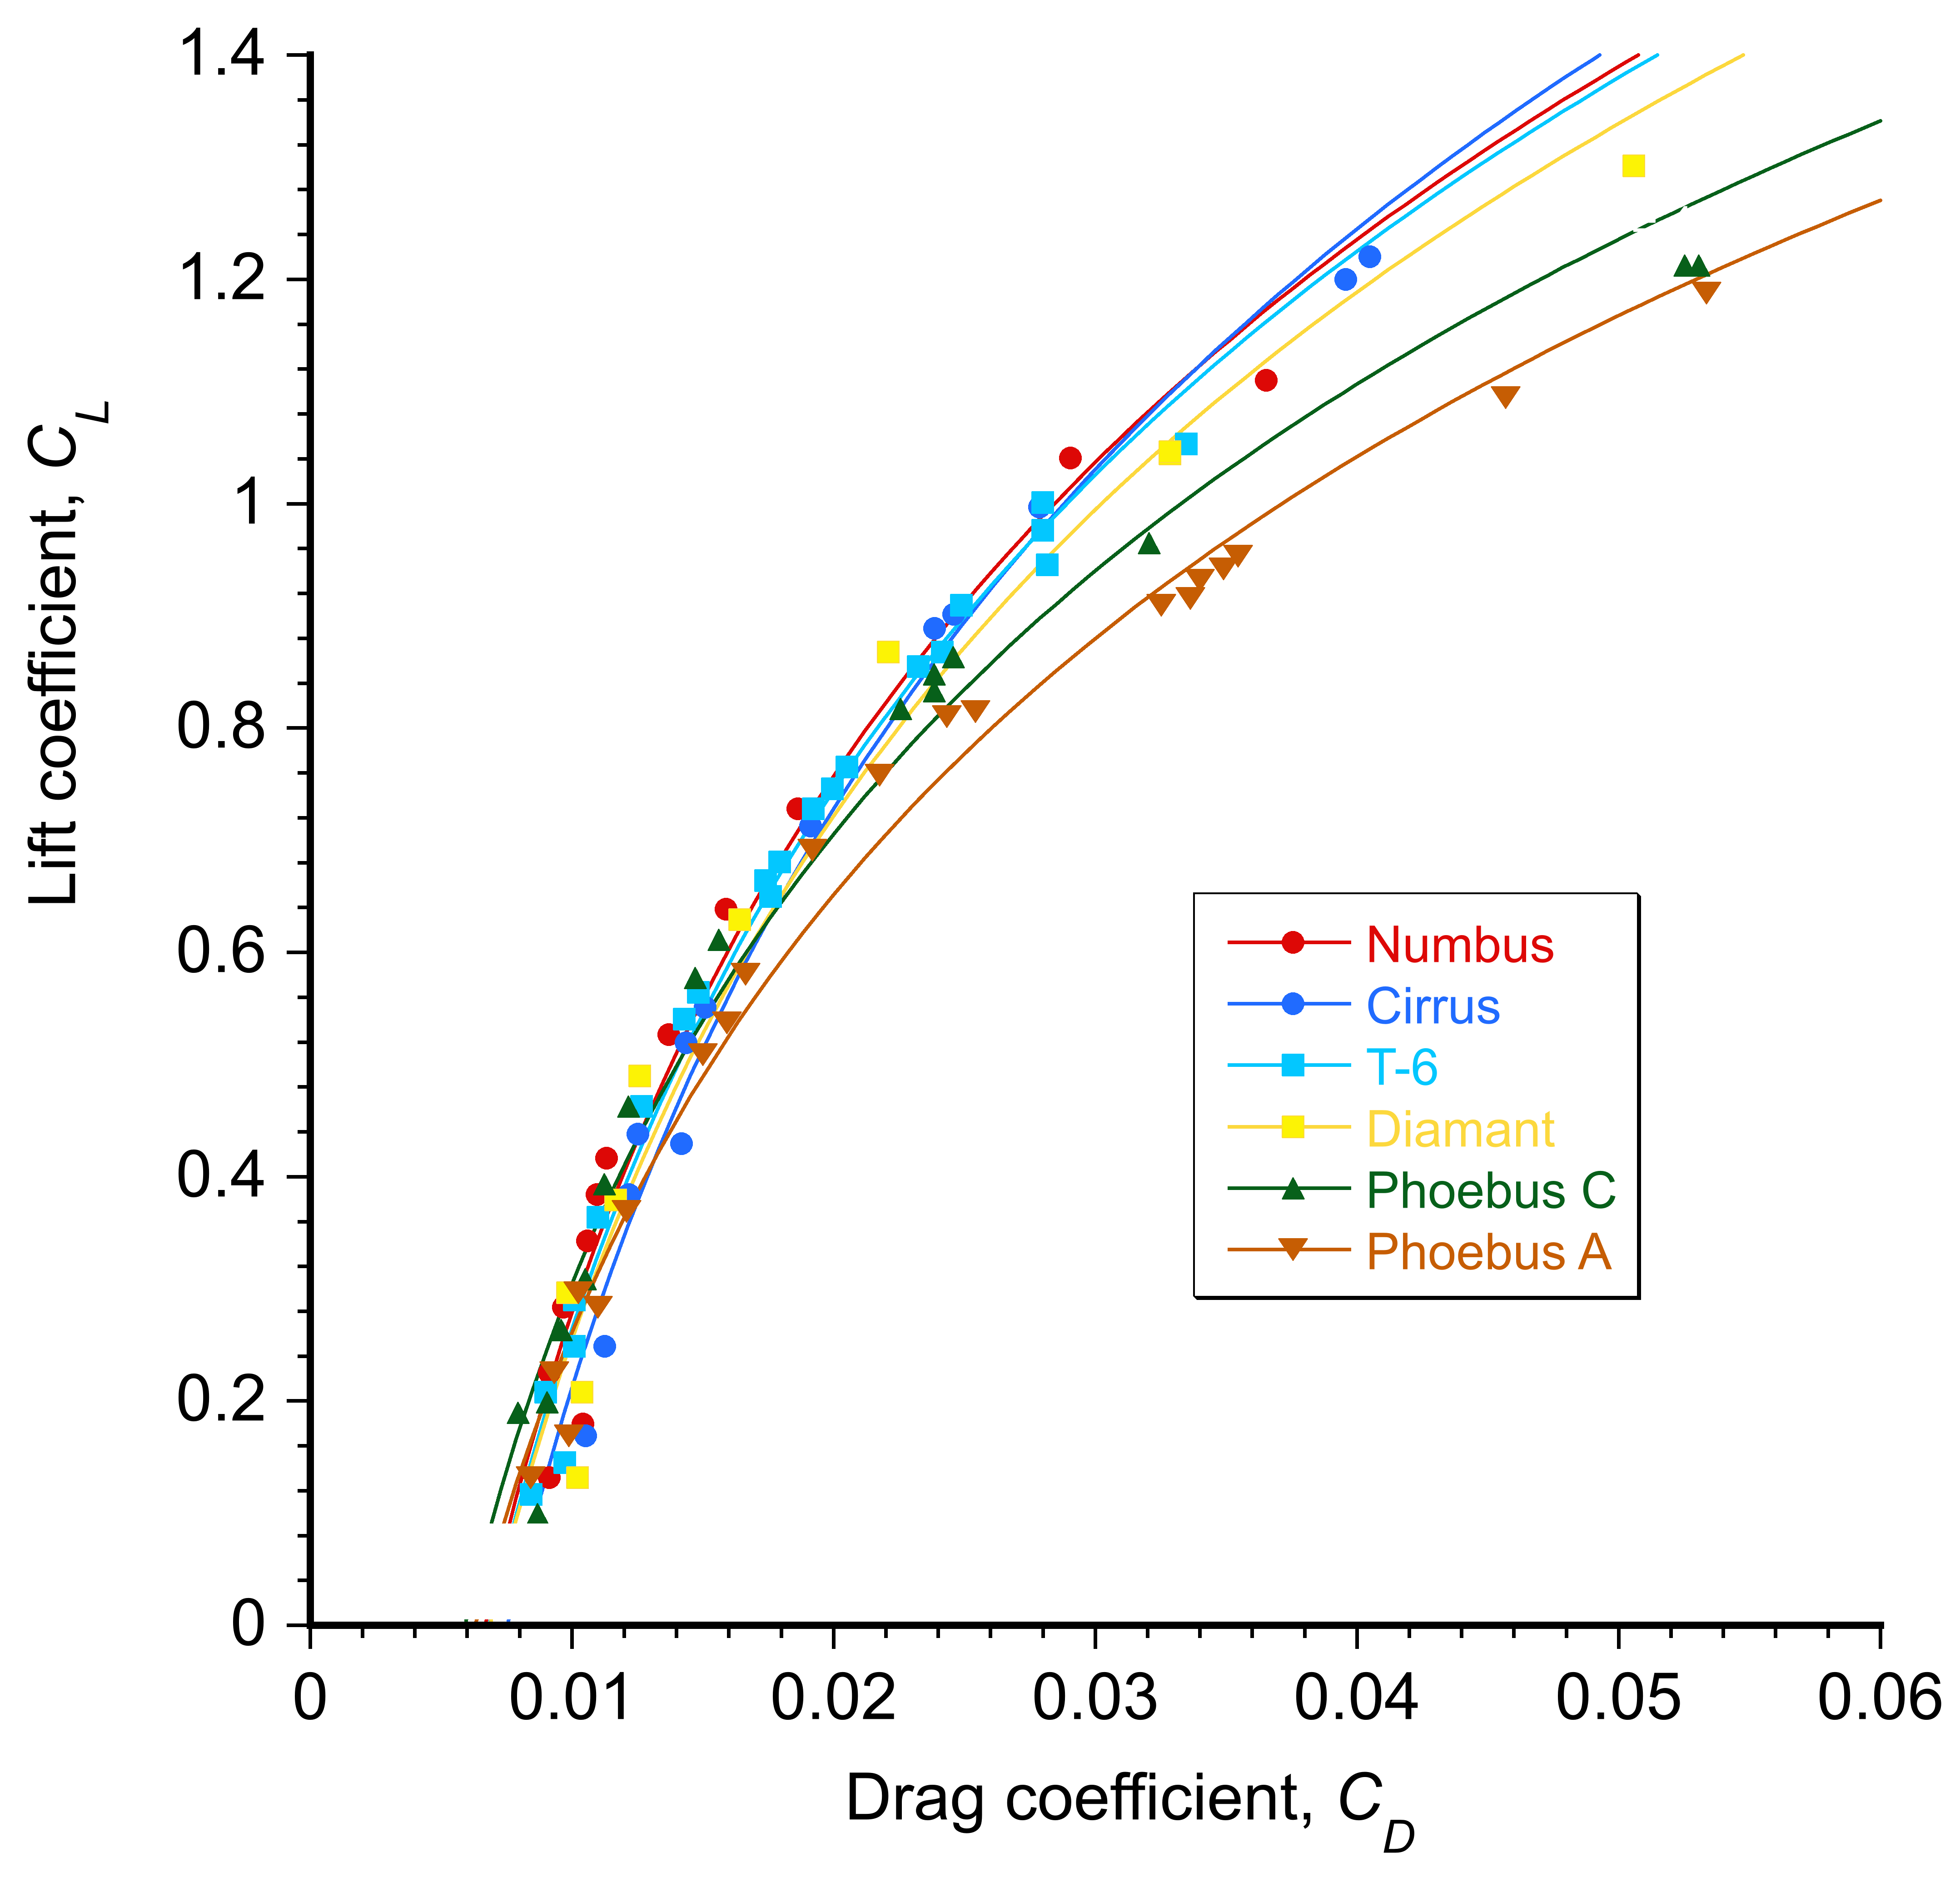
In the simplest form, a drag polar for a sailplane can be expressed in the same manner as for an airplane, i.e.,
(15) 
where  is the net average non-lifting or parasitic drag coefficient, and
  is the induced drag coefficient. The
  coefficient depends primarily on the wing and fuselage design. Theoretically, the induced drag coefficient can be expressed as
(16) 
where  is the wing’s aspect ratio, and the parameter
  is Oswald’s efficiency factor. Therefore,
(17) 
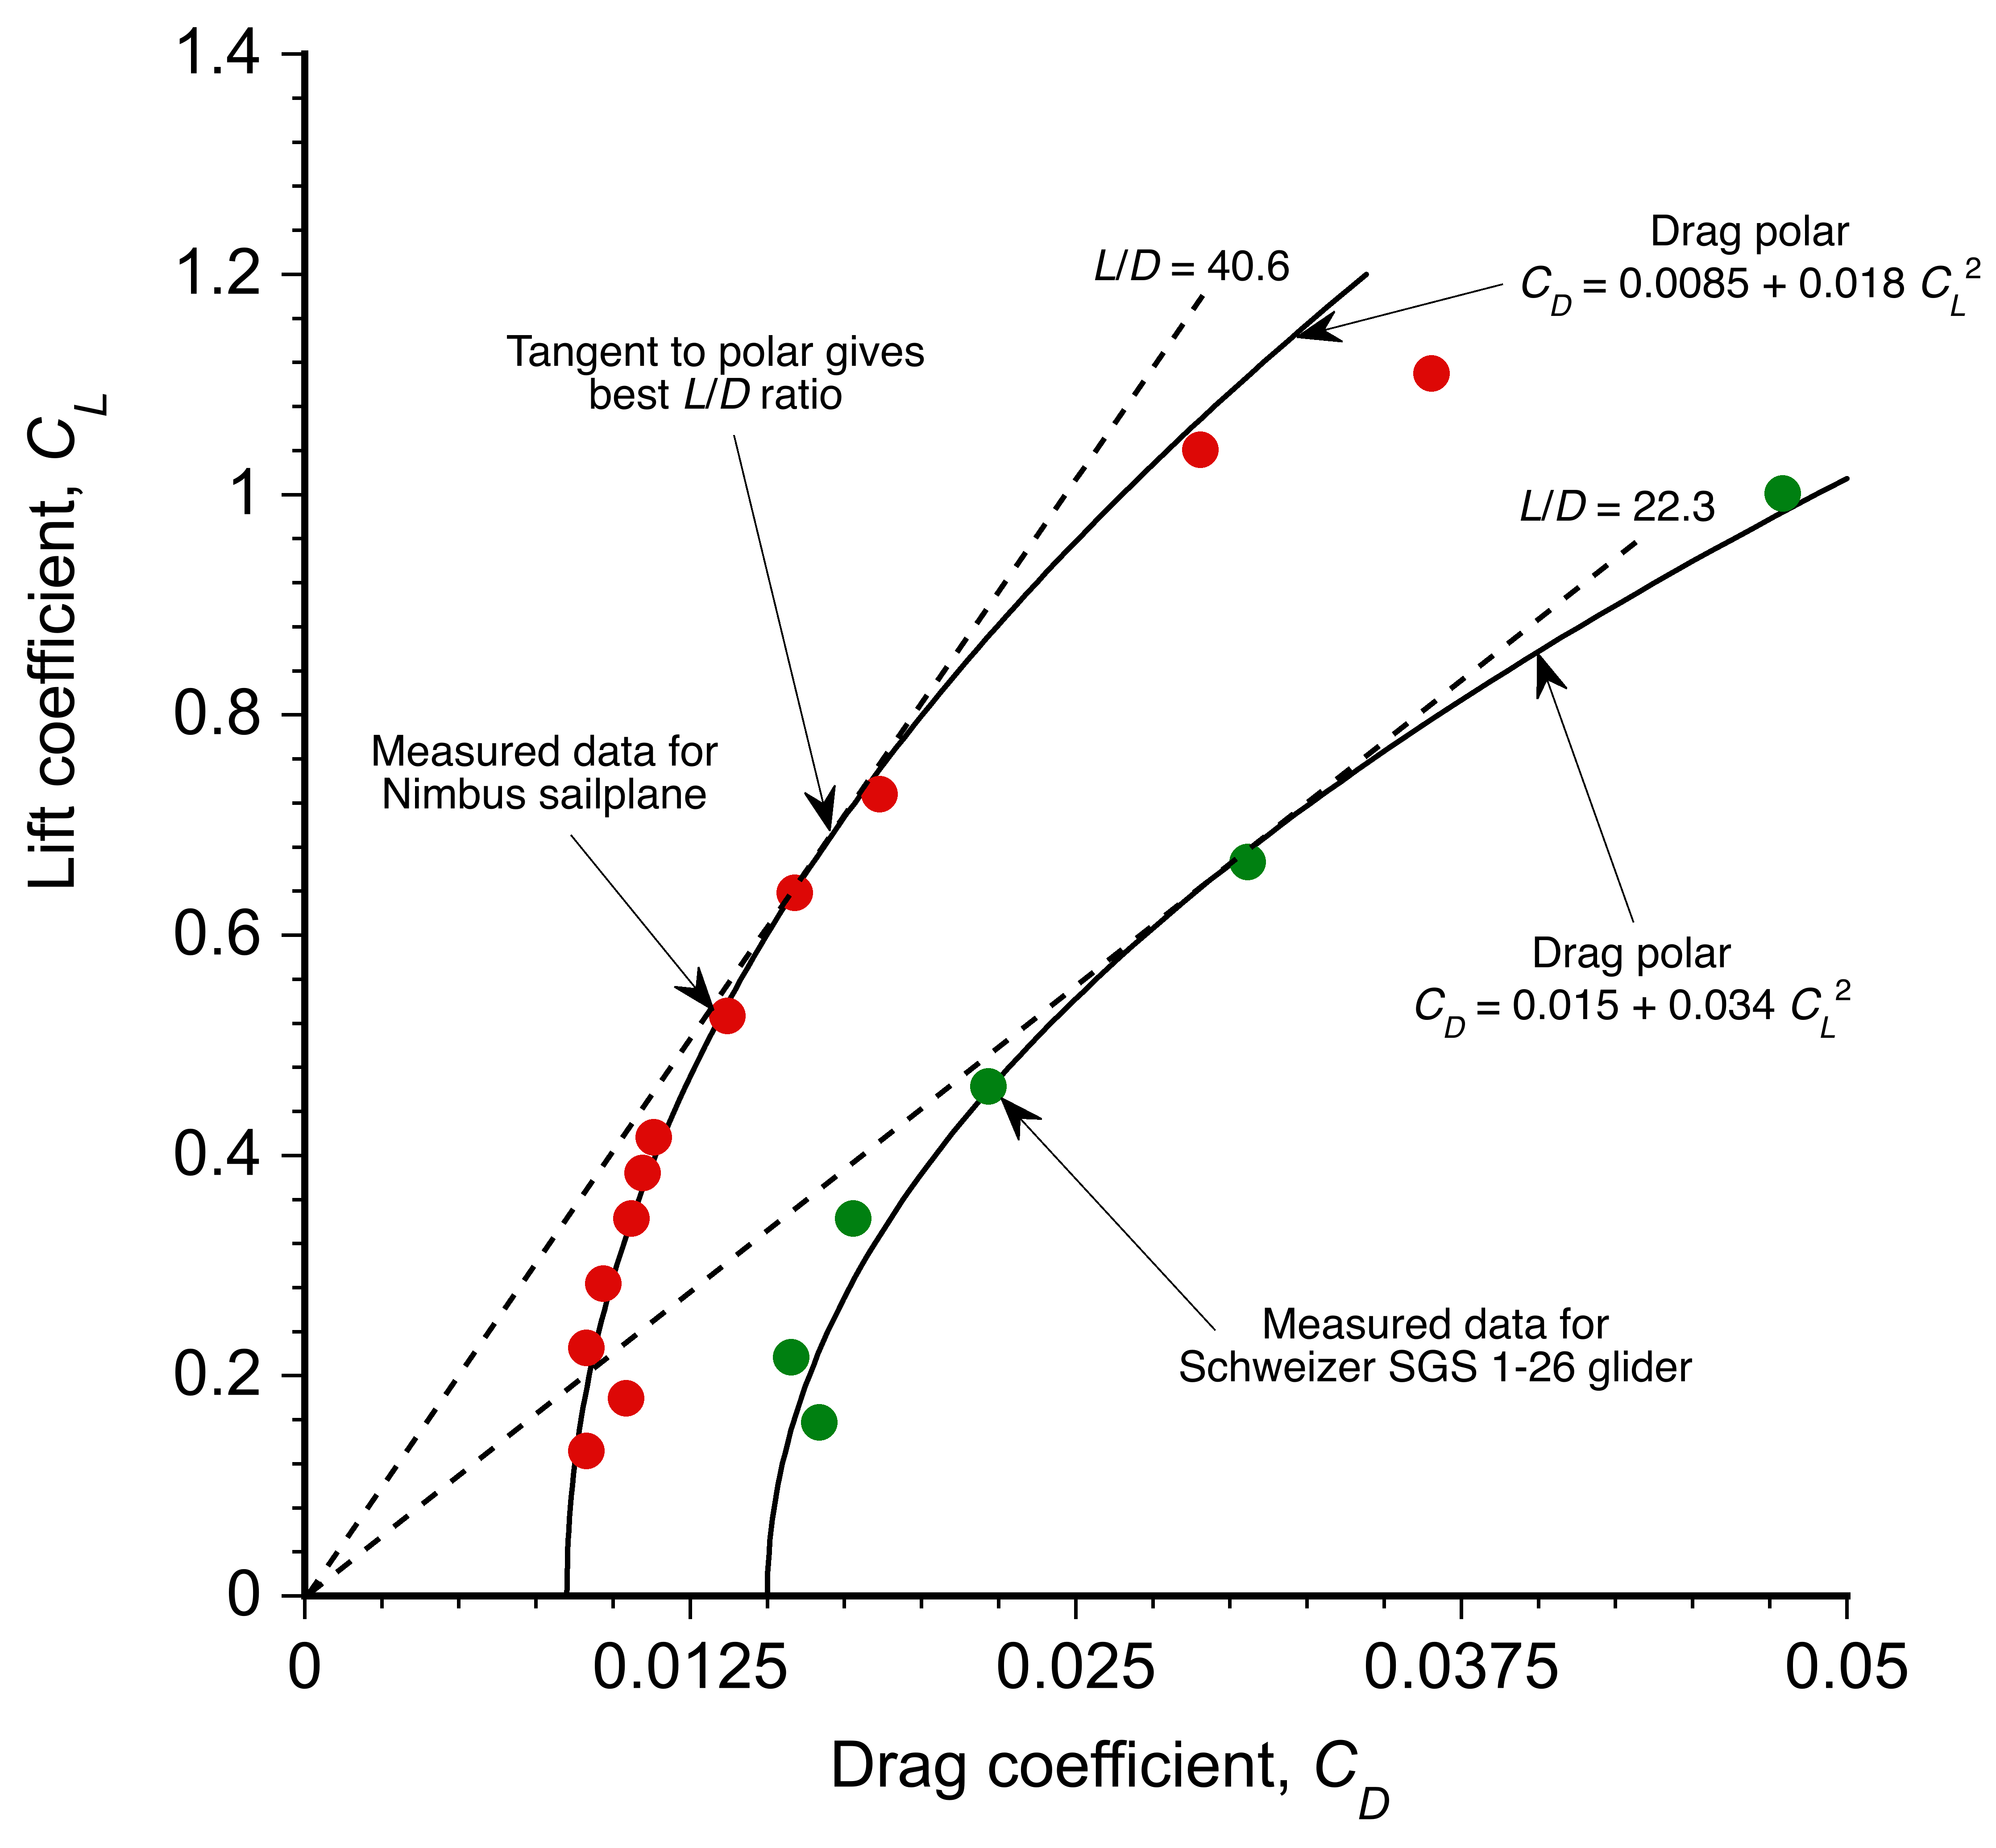
The general validity of Eq. 53 has been established for various categories and classes of airplanes, including gliders and sailplanes, as illustrated in the figure below. While the fit is imperfect, it is generally sufficiently accurate for sailplane performance calculations in the range  , i.e., below the onset of stall.
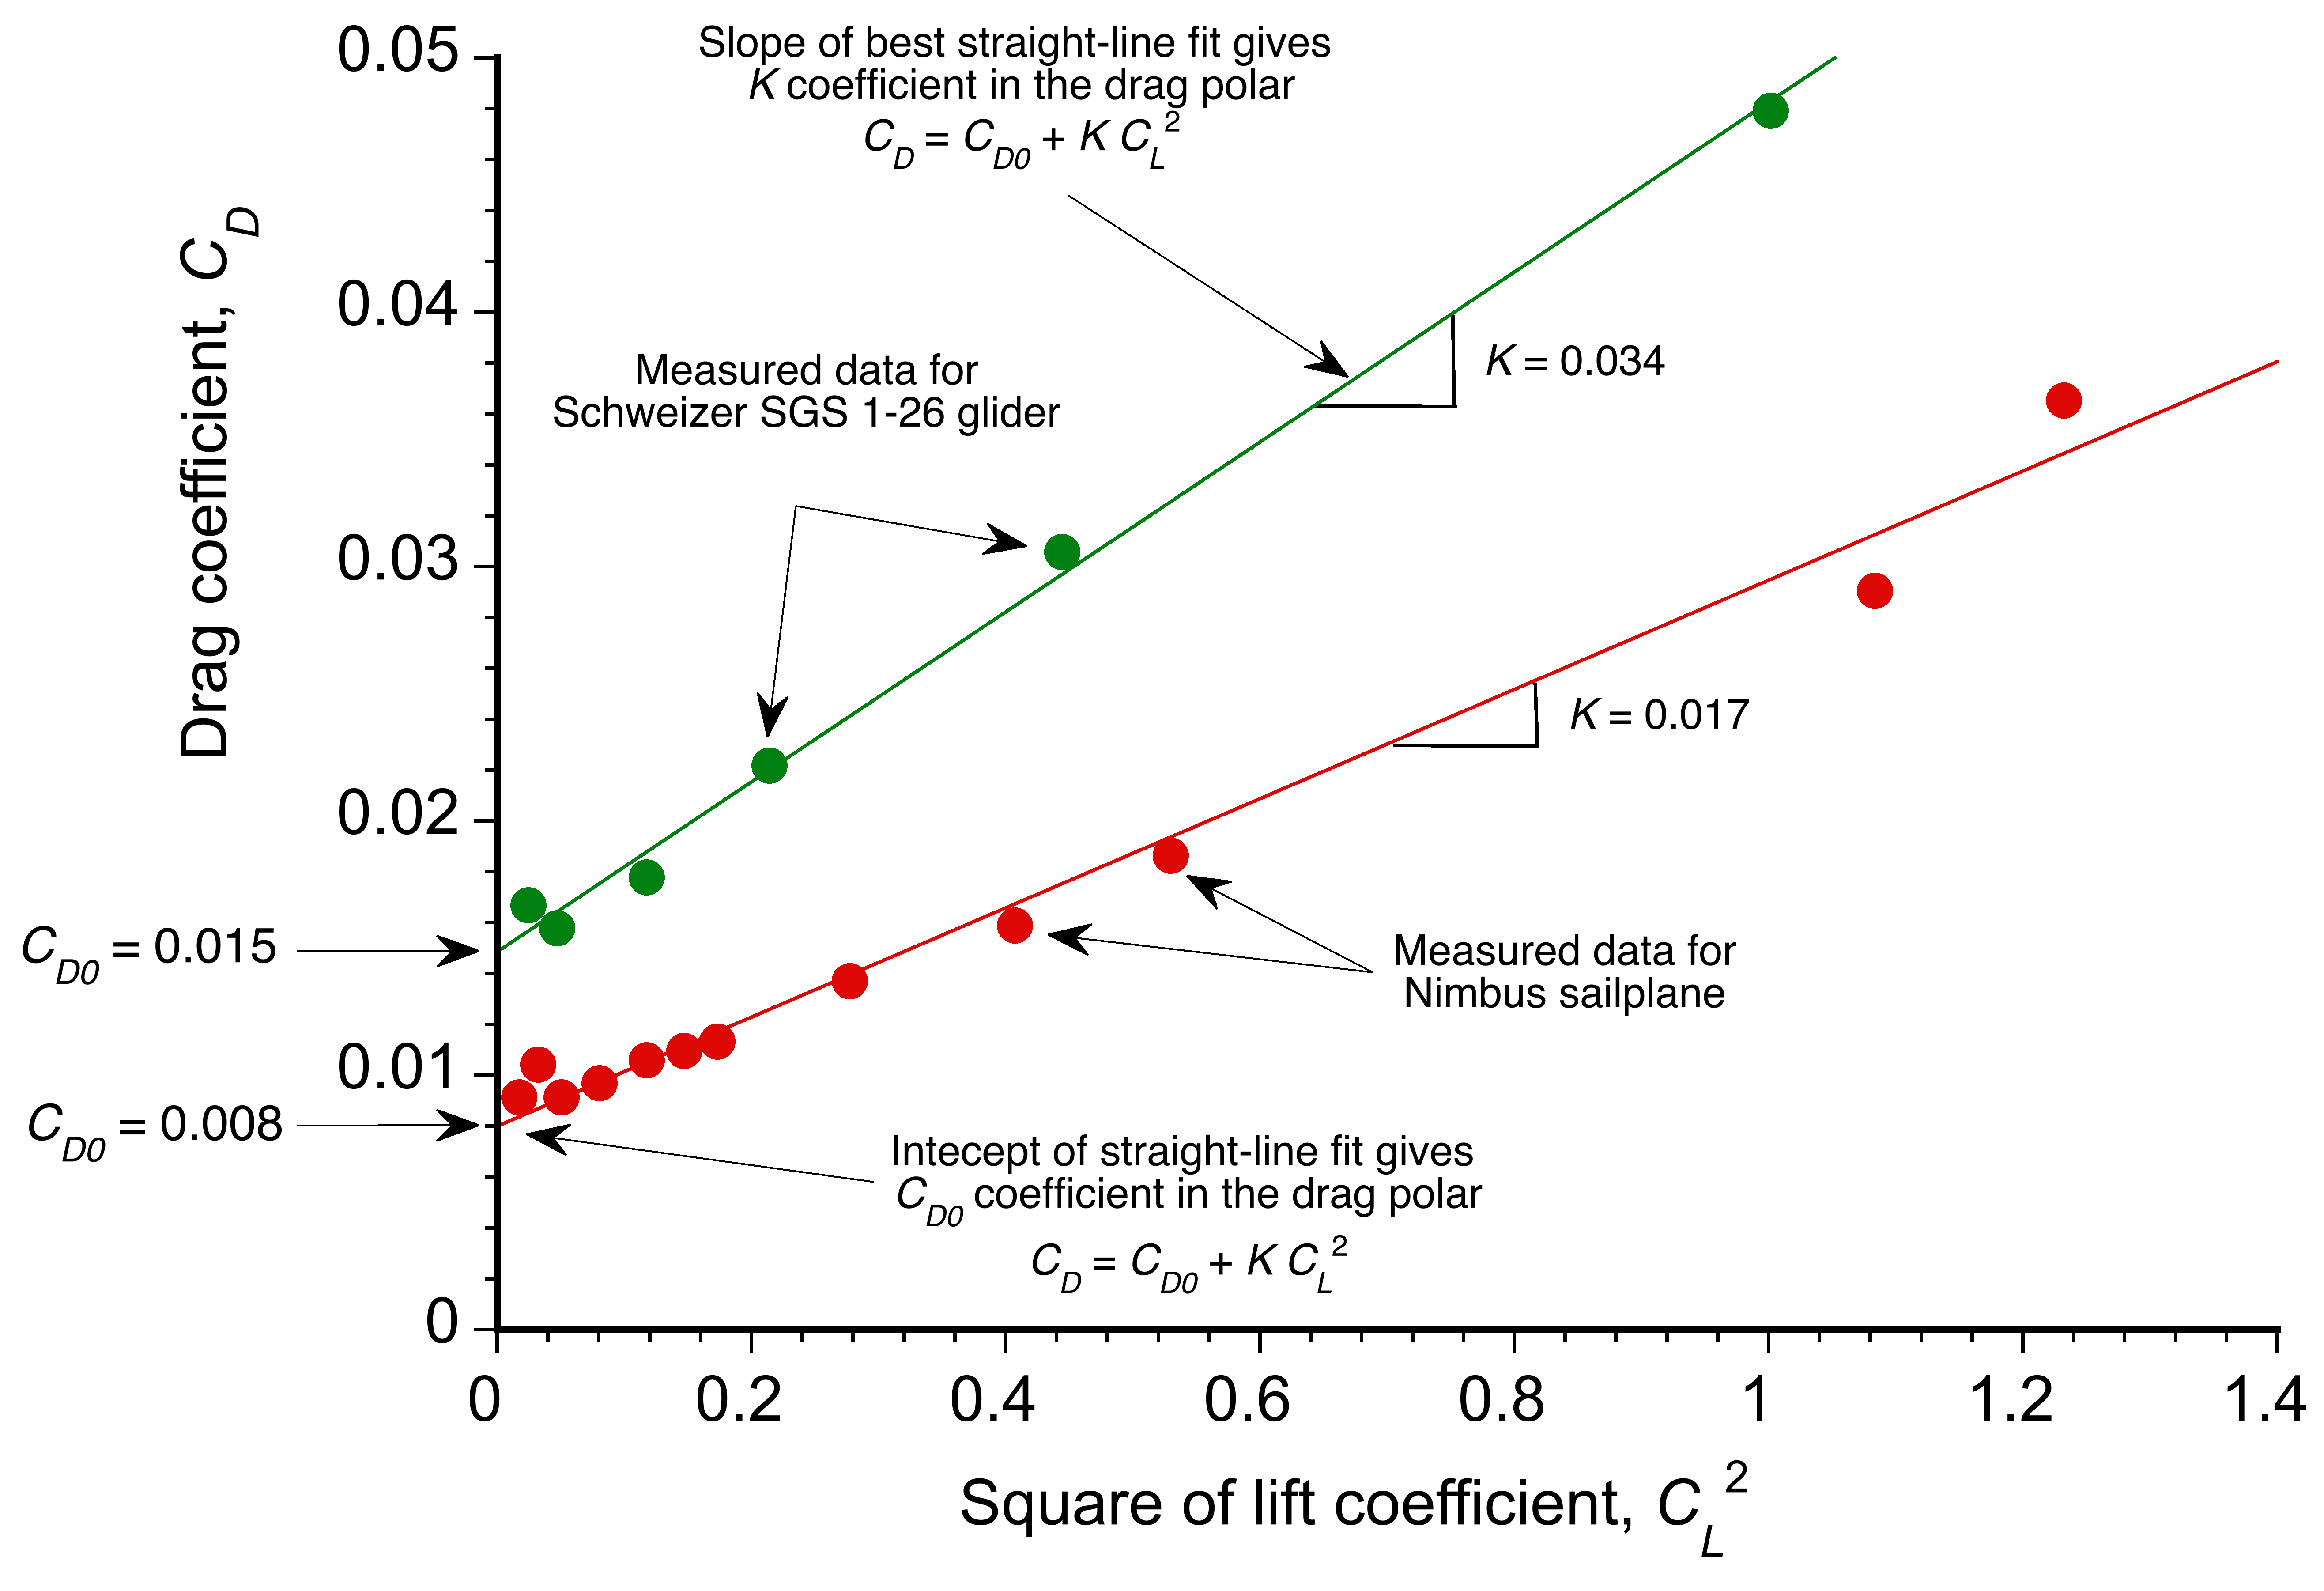
The coefficients of the polars can be obtained by plotting  versus
  , as shown in the figure below. A straight-line fit to the data then gives the value of as the slope of the line, and the value of is the intercept on the drag axis.
The parameter , called Oswald’s efficiency factor, is of paramount significance for sailplanes; its value is always less than one, but a design goal is to make it as large as possible. In aggregate, this parameter encompasses several physical effects that can be correlated with the details of the wing design, flow interference, and boundary layer separation. For a sailplane, the value of must be maximized by the careful synergistic aerodynamic design of the wing and the wing/fuselage interface, the fuselage shape, and the empennage, including component interference effects. Values of can reach up to 0.9 for some sailplanes based on flight test results, but the detailed wing design process to reach this value requires much care.
Drag Synthesis
For sailplane design, the total drag coefficient can be expressed more precisely in terms of the contributions from the wing, fuselage, and tailplane, as well as component interference effects. The latter is the most difficult to estimate and can only be approximated. The process of determining an aircraft’s total drag by summing its components is known as a drag synthesis method.
Wing
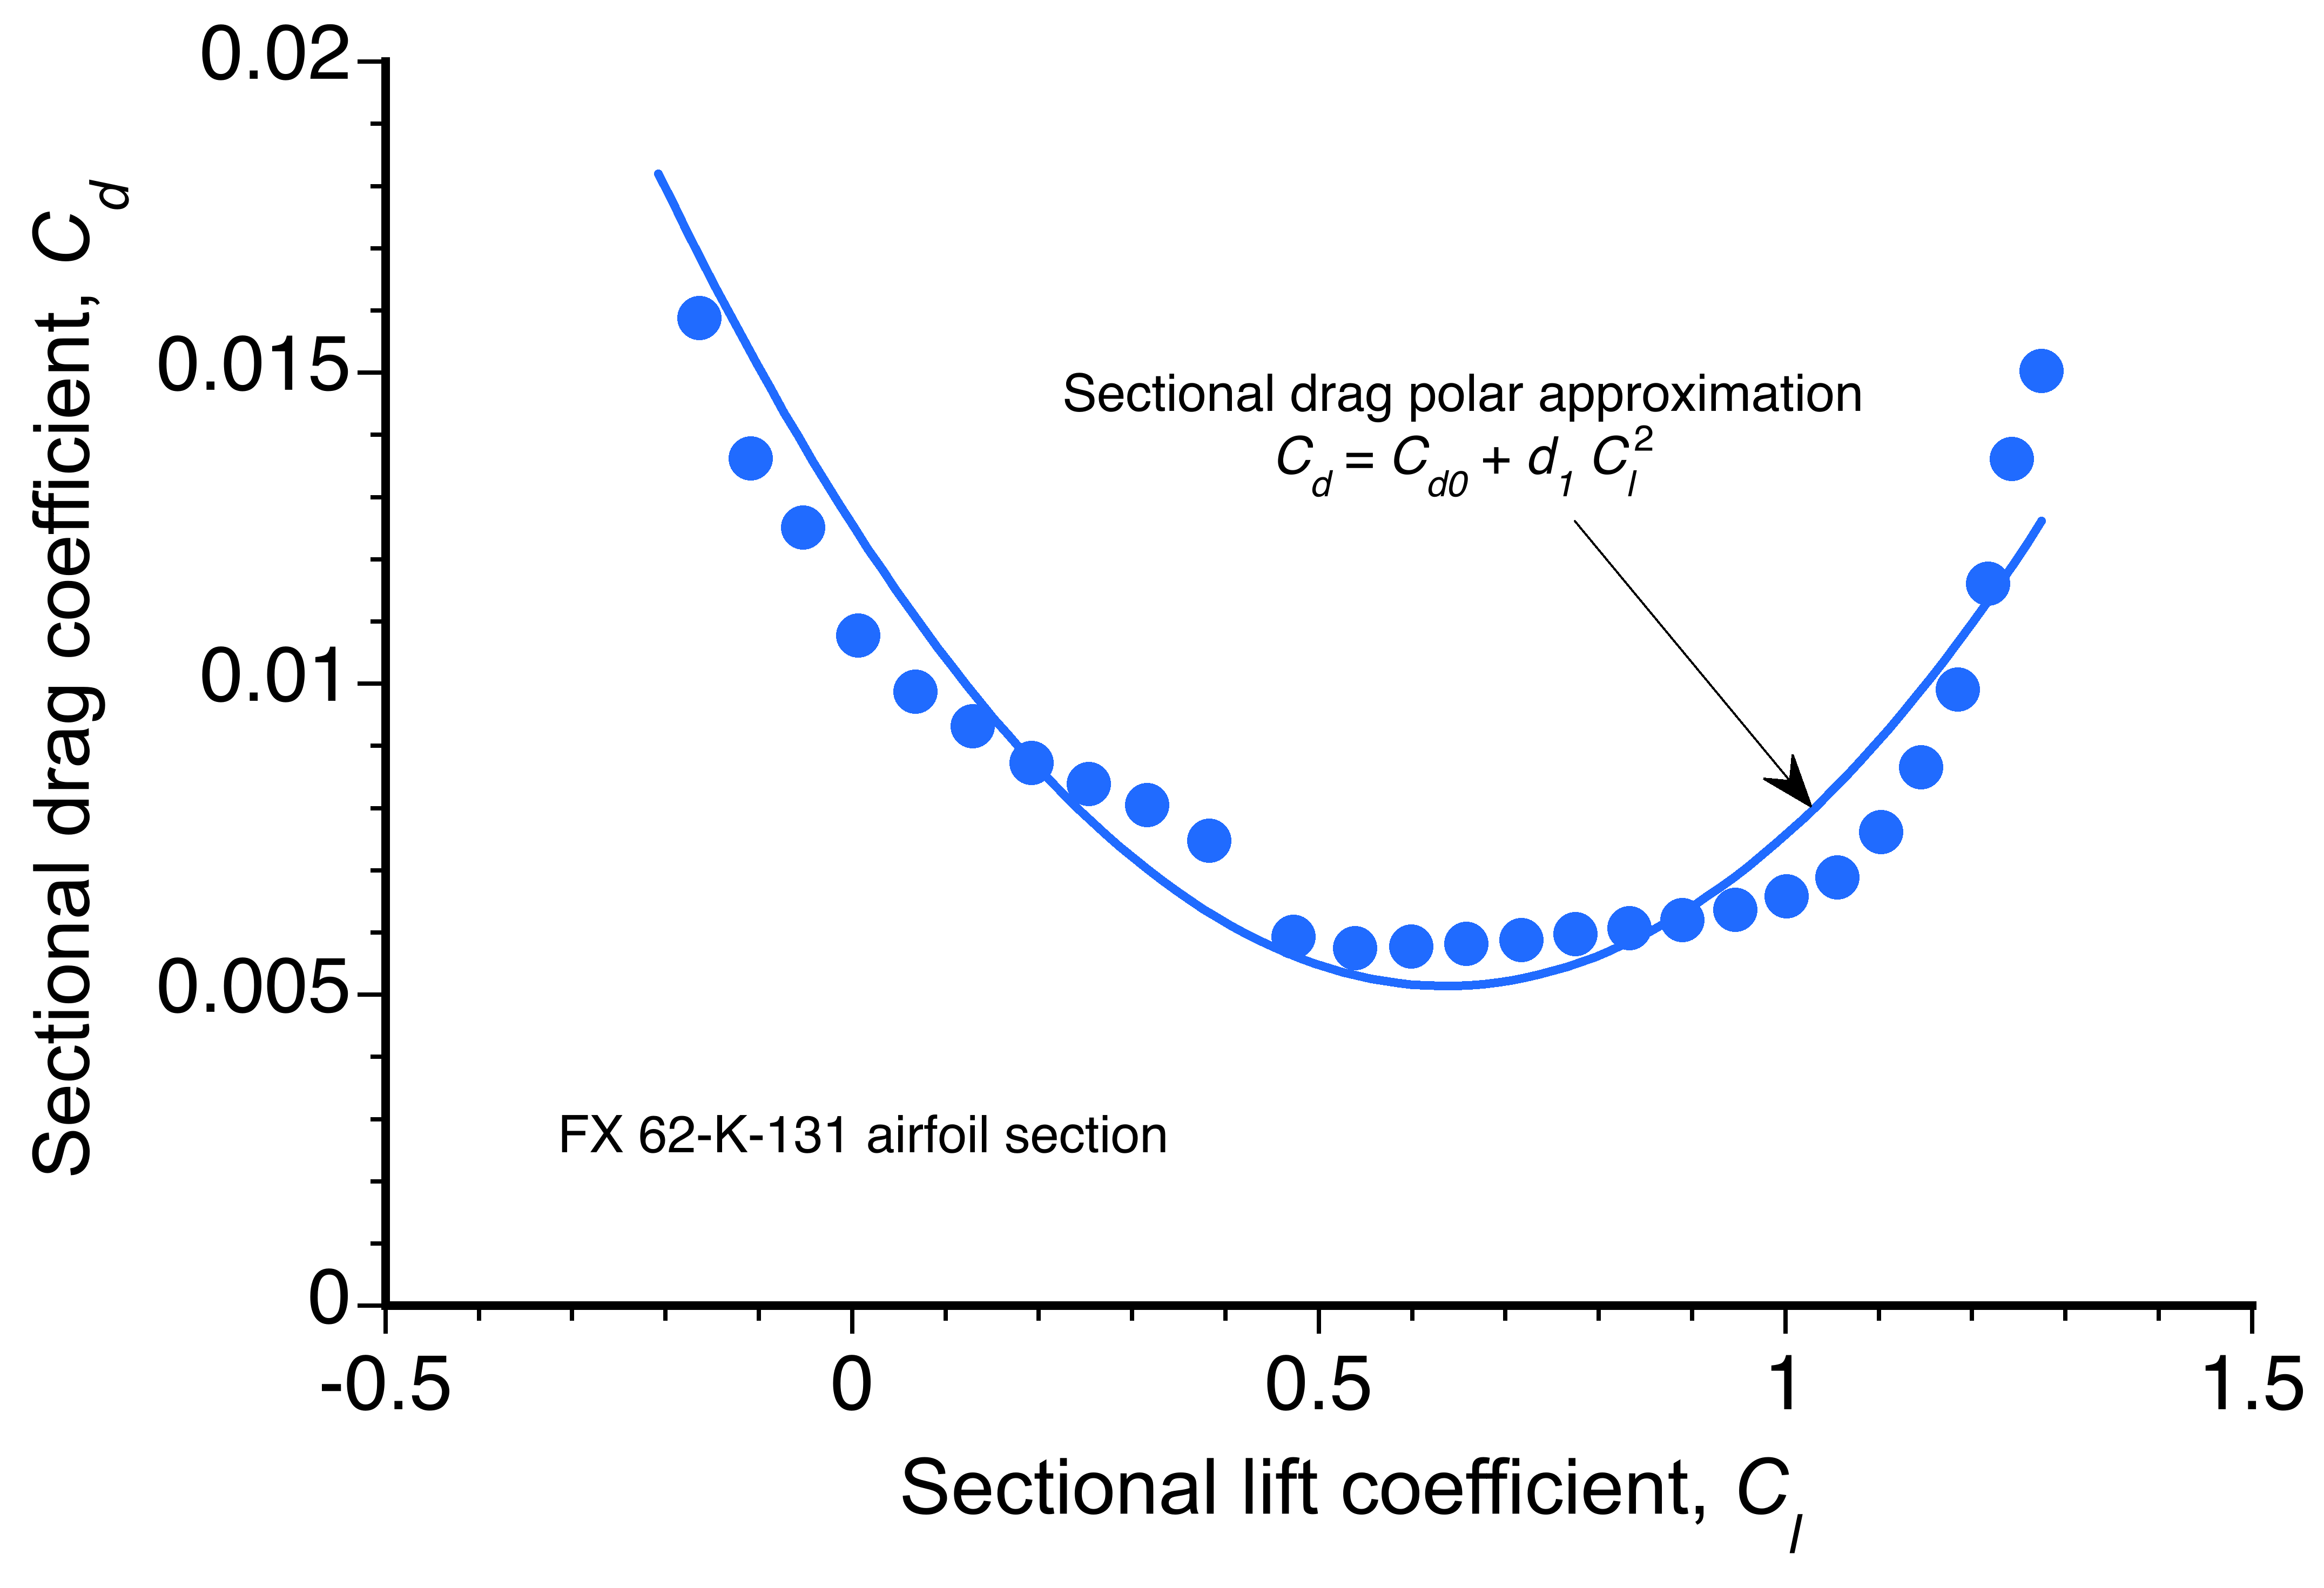
The wing drag dominates the performance of a sailplane, as it does on nearly all airplanes. Wing drag arises from two sources: the profile drag at the sectional level and the induced drag, i.e., drag induced by lift. The profile drag comprises skin friction and pressure drag, which can be obtained from two-dimensional airfoil data for the specific wing section. Such data are readily available for many airfoil sections used specifically for sailplanes. A good approximation at the sectional level is
(18) 
where  is the non-lifting drag coefficient and
  is the growth in the drag coefficient with the lift coefficient,
  .
.
A representative plot of the drag characteristics of the FX 62-K-131 airfoil is shown below. While the fit is imperfect, it reasonably agrees with the actual aerodynamic performance, which in this case is for a Reynolds number of 106. It should be recognized that airfoils used on sailplanes are usually of the “laminar flow” type, so the value of and the coefficient  depend on Reynolds number.
Assuming these preceding values can be suitably obtained based on measurements, which are generally available from airfoil data catalogs or other publications, and that each section of the wing operates at the same lift coefficient,  , which is a reasonable assumption for an ideal, elliptically loaded wing, then the profile drag of the entire wing can be expressed as
(19) 
The induced drag of the wing can be expressed as
(20) 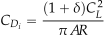
where  is the spanwise efficiency factor. For a perfect, elliptically-loaded wing,
  . For a well-designed sailplane wing with appropriate wing taper and twist, it is reasonable to expect to be in the
  range. Therefore, the total drag of the wing can be expressed as
(21) 
Fuselage
The fuselage of a sailplane is generally well streamlined but suffers from the same problems as other aircraft, including disturbances caused by cockpit windows, gap leaks at control surfaces, wing-fuselage interference, as well as the presence of probes and antennas. While the drag caused by any one of these sources is relatively small, the aggregate drag can be significant. The maximum cross-sectional area of the fuselage is generally kept as low as possible by having the pilot sit in a semi-prone position.
The fuselage drag can be expressed as
(22) 
where  is determined based on the maximum cross-sectional area,
  , and slenderness ratio of the fuselage, and
  is the reference area, which is usually the wing planform area on which all aerodynamic coefficients are based, i.e.,
  . The coefficient
  accounts for the increased drag of the fuselage when it is operating at an angle of attack.
Empennage
The empennage comprises the horizontal and vertical tail surfaces, along with their respective control surfaces (elevator and rudder). In trimmed flight, the vertical tail will not produce lift. The horizontal tail will produce some lift, but it is small enough for its induced drag to be neglected. Therefore, it is reasonable to represent the empennage drag as a profile contribution, i.e.,
(23) 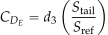
where  is the sum of the projected planform areas of the tail surfaces, and
  depends on the specific tail design. Values of can be most reliably obtained from wind tunnel tests on scaled models at or near the Reynolds numbers of flight; historical data derived from flight tests are also useful. A value of = 0.008 is often used for sailplanes.
Total Drag
The total drag on the sailplane is the sum of the preceding area-normalized drag components, i.e.,
(24) 
Note that all individual values of the drag coefficients have now been normalized to the same reference area, allowing them to be added directly without adjustment. Substituting the values gives
(25) 
Notice that it is possible to group the preceding terms into non-lifting and lifting parts for the entire sailplane, i.e.,
(26) 
or
(27) 
where the non-lifting part is
(28) 
and the induced part is
(29) 
The total drag values obtained by this form of synthesis are typically multiplied by a factor of 1.1 to account for component flow interference effects, i.e.,
(30) 
Values of the Coefficients
The values of the published coefficients for several sailplanes are given in the table below. These values can be used to reconstruct the drag polar for each sailplane, from which further analysis of its performance can be conducted.
| Sailplane | Airfoil | |
|
(ft2) |
|
 |
 |
 |
|
|
| Nimbus 2 | FX67-K-170 | 0.0056 | 0.0031 | 155.0 | 28.6 | 0.12 | 0.030 | 0.0117 | 0.046 | 0.94 |
| ASW 17 | FX62-K-131 | 0.0047 | 0.0026 | 158.0 | 27.3 | 0.20 | 0.029 | 0.0123 | 0.054 | 0.06 |
| ASW 12 | FX62-K-131 | 0.0047 | 0.0026 | 140.0 | 25.0 | 0.15 | 0.027 | 0.0134 | 0.114 | 0.09 |
| PIK 20 | FX67-K-170 | 0.0056 | 0.0031 | 107.0 | 22.5 | 0.20 | 0.043 | 0.0149 | 0.060 | 0.39 |
| Standard Cirus | FX66-S-196 | 0.0068 | 0.0028 | 107.0 | 22.5 | 0.23 | 0.043 | 0.0149 | 0.038 | 2.23 |
| ASW 15 | FX61-5-161 | 0.0066 | 0.0028 | 118.0 | 20.5 | 0.21 | 0.039 | 0.0163 | 0.059 | 0.048 |
| Standard Libelle | FX62-K-131 | 0.0070 | 0.0025 | 103.0 | 23.5 | 0.15 | 0.036 | 0.0142 | 0.068 | 1.06 |
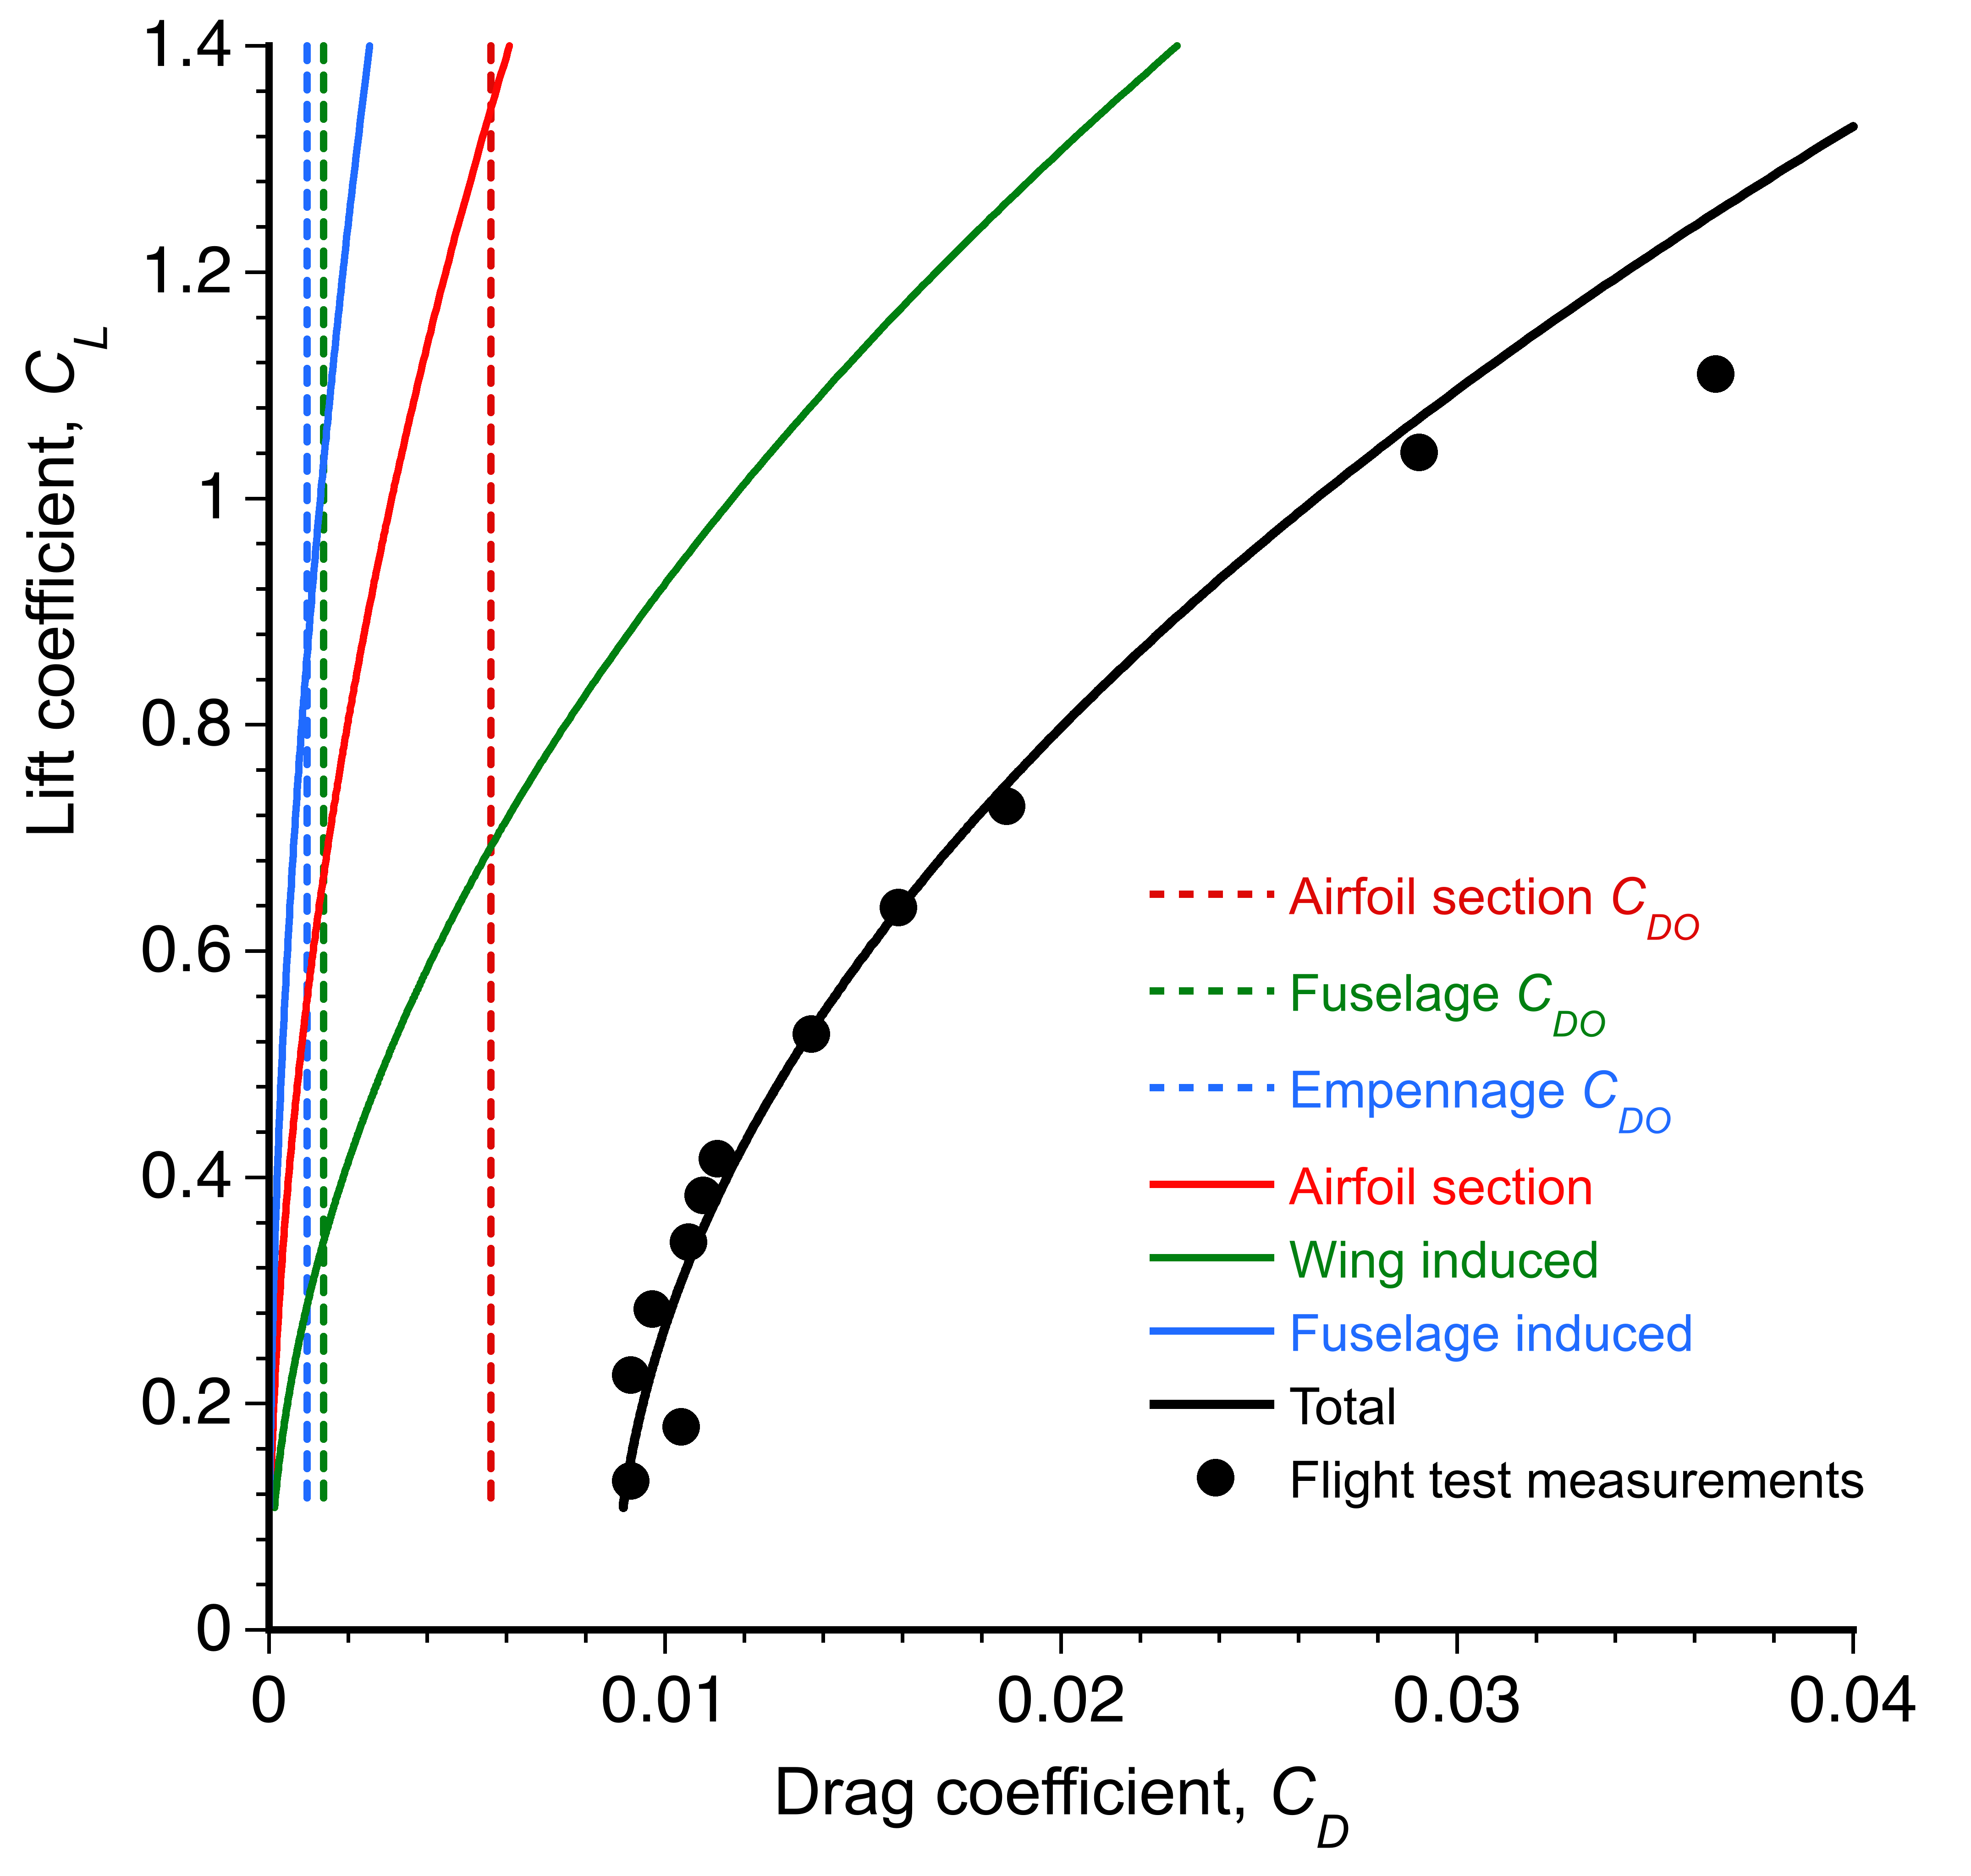
What is evident from this drag breakdown analysis is that the wing dominates the gliding performance, as shown in the figure below. The induced drag dominates at lower airspeeds and higher lift coefficients, but the profile contribution is the most important for gliding at higher airspeeds. Hence, a laminar flow airfoil section is needed for the best gliding performance. Fuselage drag accounts for about 15% of the total drag and is insensitive to the angle of attack. The empennage drag is about 10% of the total drag, which is also relatively small compared to the total drag on the sailplane.
Gliding Polars
Maximizing the of a sailplane is important, and in competitions where both gliding distance and speed are essential, the best must be obtained at relatively high airspeeds. This is where the gliding polar becomes useful, an example being shown in the figure below.
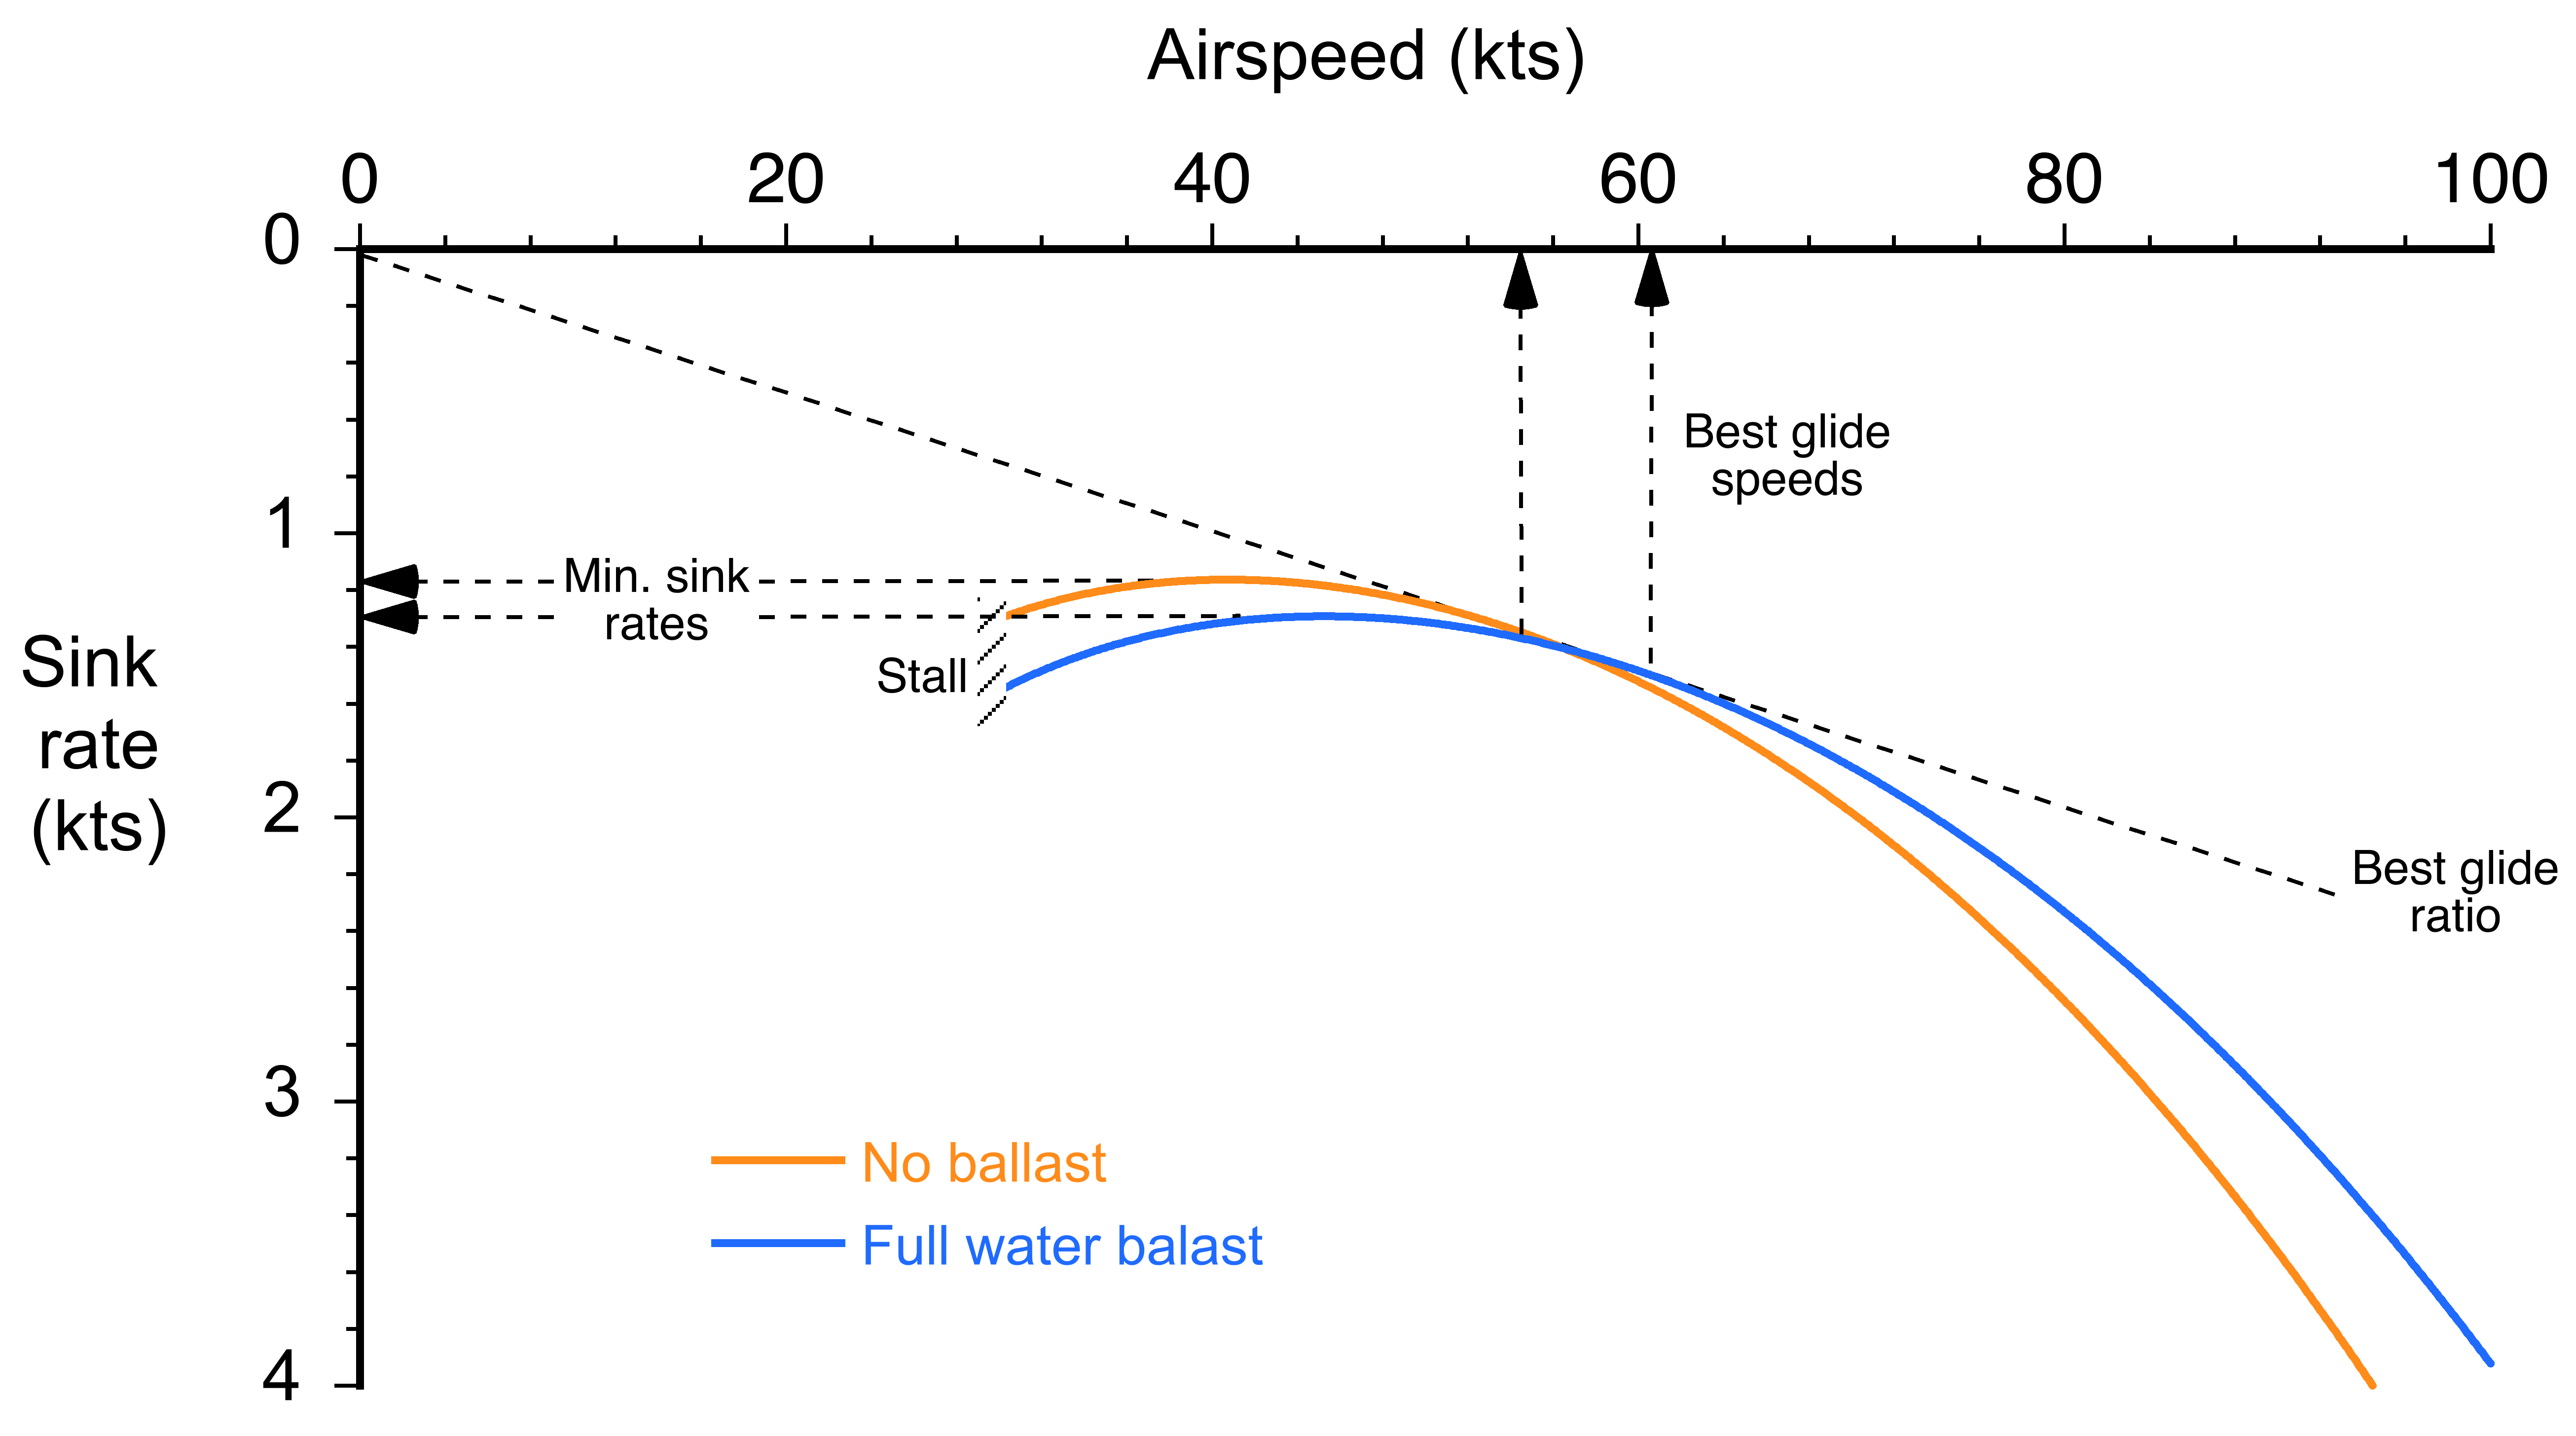
A gliding polar is equivalent to a classic hodograph for an airplane, but is specific for descending flight. It is a dimensional plot in terms of airspeed and rate of descent (sink rate). It can be constructed for any particular sailplane at a given weight and density altitude using essential characteristics such as its flight weight, wing area, and drag polarity. The airspeed is the true airspeed, which can be measured from the indicated airspeed corrected for density altitude and static position error effects, and the rate of descent can be measured using the variometer.
Significance of the Polar
The gliding polar shows two important flight conditions. The first is the airspeed to fly for the minimum sink rate or rate of descent,  . Flying at this airspeed will allow the sailplane to stay in the air for the maximum time, i.e., maximum flight endurance. It will also be the airspeed to fly while climbing in rising air, i.e., while circling in thermals to gain altitude. Notice from the polar that the minimum sink condition is close to the stall speed, so the sailplane must be flown precisely to avoid stalling. Pilots learn to do this by “feel,” and experienced pilots will not “chase” the reading on the airspeed indicator because it lags what the sailplane is doing aerodynamically.
The airspeed for the second flight condition is the best glide ratio,  . A straight line drawn from the origin of the polar at (0,0) to any point on the polar gives the lift-to-drag ratio. The best glide ratio, which is independent of airspeed, is obtained when this line touches the polar at a tangent. Notice from the polar that the best glide ratio is obtained at a higher airspeed when the sailplane is flown at a higher weight. Because the gliding airspeed is directly proportional to wing loading, i.e., the ratio of weight to wing area, all things being equal, a sailplane with a higher wing loading can glide at a higher airspeed and travel further in a given time.
In this latter regard, modern competition gliders carry jettisonable water ballast in the wings. The extra weight of water ballast is advantageous if the strong thermals and soaring conditions allow the sailplanes to climb in rising air. Although heavier gliders have a slight disadvantage when climbing in thermals because they have a higher sink rate, they can achieve a higher airspeed at any given glide angle. This latter characteristic is advantageous in strong updraft conditions when sailplanes spend only a small amount of time climbing in thermals. To minimize landing loads on the airframe, the pilot can jettison the water ballast at any time, and always before landing.
Dissection of the Gliding Polar
The dissection of the gliding polar exposes a deeper understanding of the underlying aerodynamics of the sailplane. As previously discussed, the airspeed along the flight path of angle can be decomposed into horizontal and vertical components, i.e., , which is downward, and , which is horizontal, i.e.,
(31) 
Using the small-angle assumption is easily justified for a sailplane as the glide angles are inevitably less than 5 degrees. The rate of descent or sink speed is
(32) 
From a force equilibrium in a glide, as previously shown, the component of weight balances the drag, i.e.,
(33) 
Eliminating the term gives
(34) 
Best Glide Condition
Because the gliding polar is a dimensional plot, it depends on the weight of the sailplane,  . This means that the lift and drag coefficients will have different values at different flight weights because
(35) 
Unlike a powered aircraft, which burns off fuel and so its weight constantly changes, the weight of a sailplane stays constant unless it drops water ballast. Therefore, for a given airspeed and density altitude, the lift coefficient increases linearly with the wing loading, . The corresponding drag coefficient comes from the assumed polar, i.e.,
(36) 
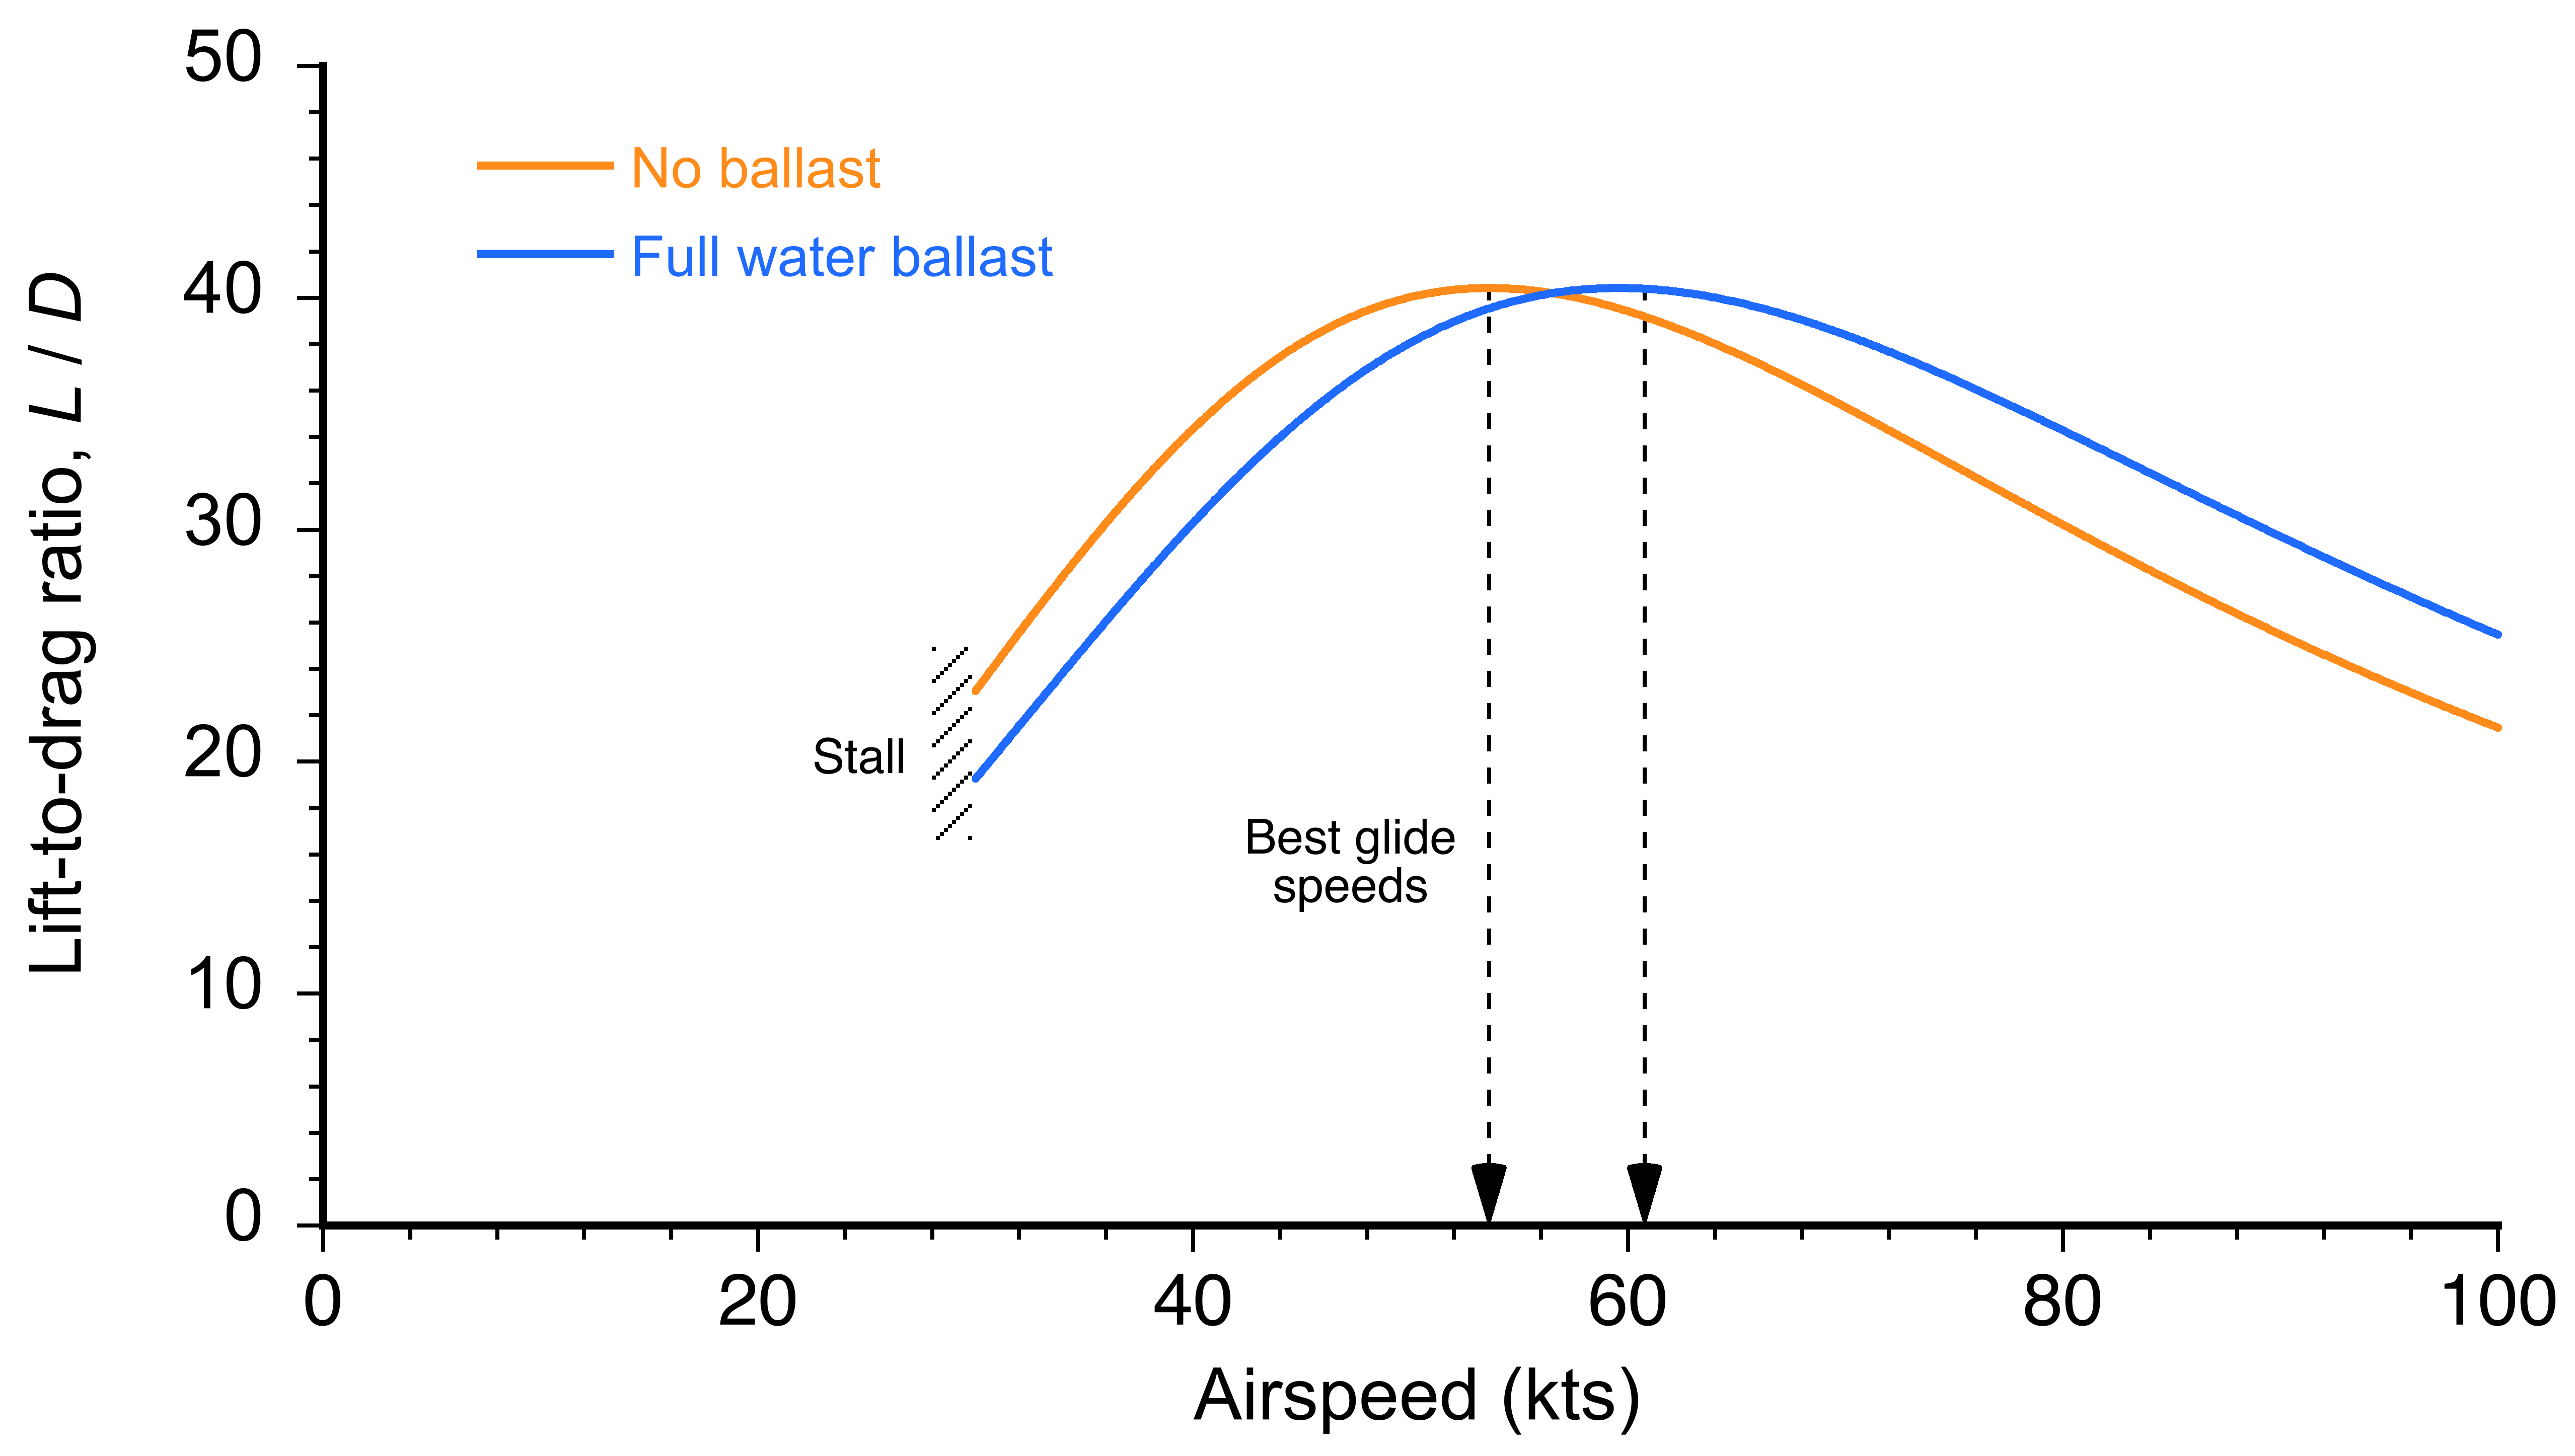
Therefore, the lift-to-drag ratio,  , as a function of airspeed,
  , follows directly, as shown in the figure below. It is clear that the maximum lift-to-drag ratio is not affected by weight; however, the airspeed at which the maximum lift-to-drag ratio increases with weight, i.e., by carrying water ballast.
The glide angle, which is inversely proportional to the lift-to-drag ratio, is
(37) 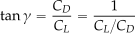
so the glide angle is
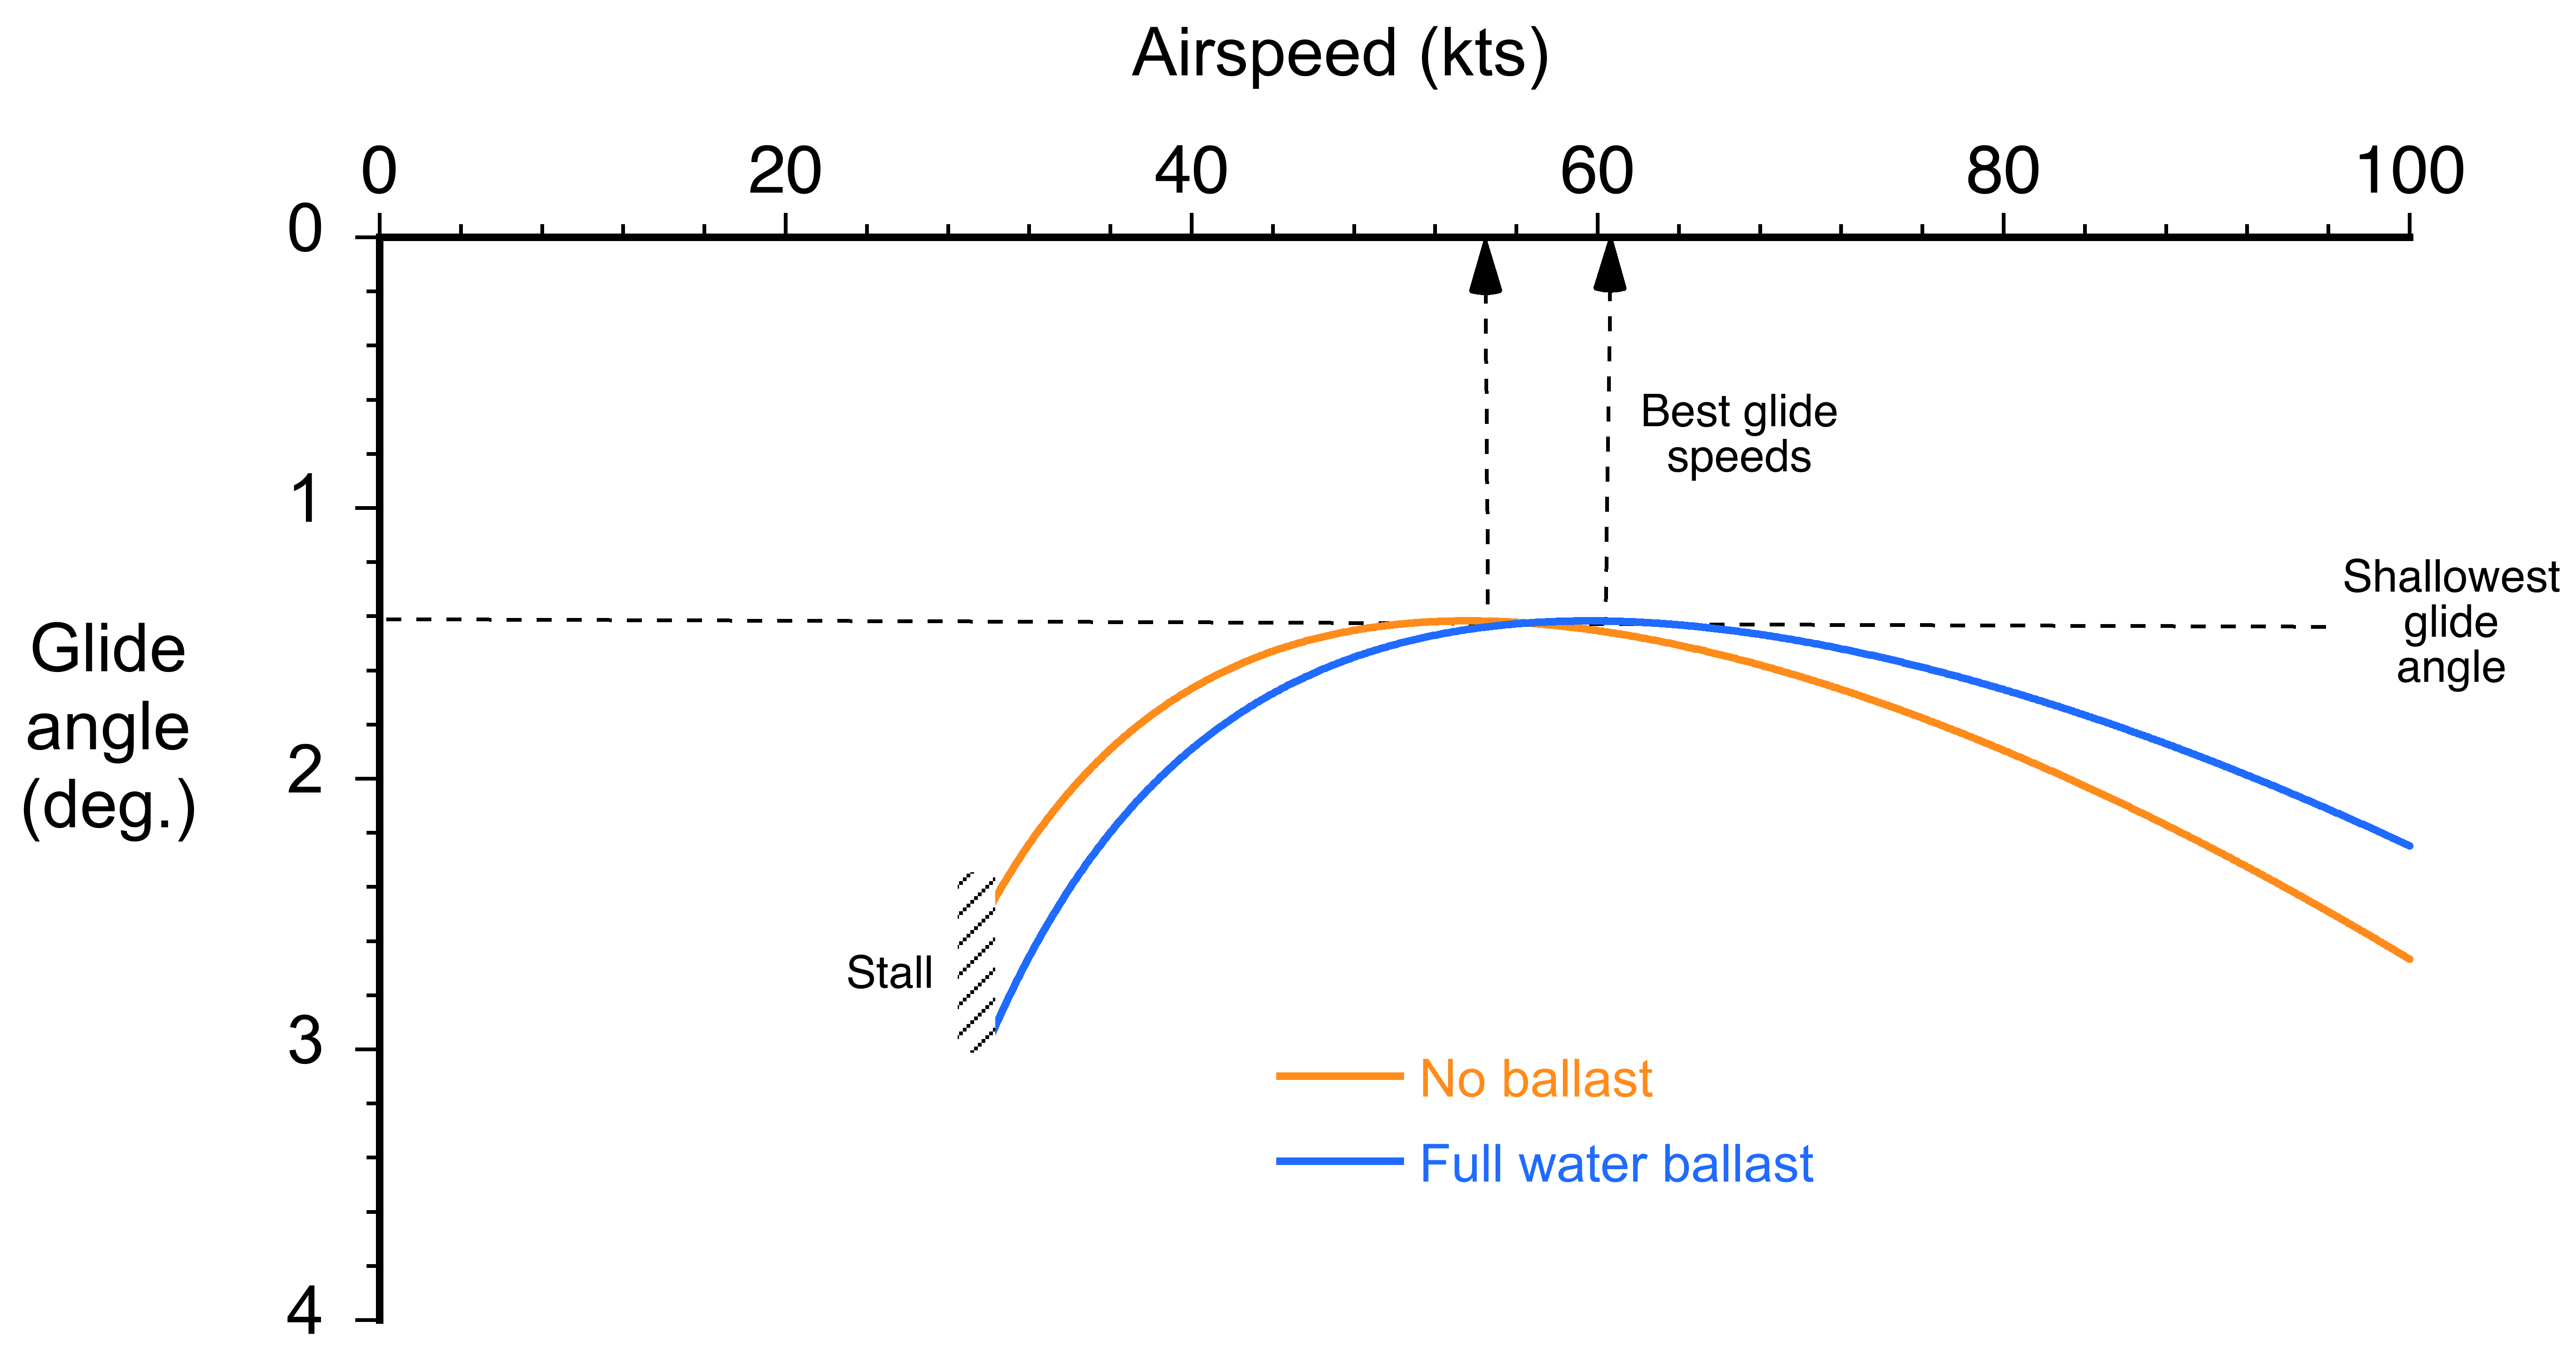
(38) 
This outcome shows that the higher the sailplane’s lift-to-drag ratio, the shallower the glide angle. As with the lift-to-drag ratio, the glide angle depends on weight, so the best glide angle can be obtained at a higher airspeed with the addition of water ballast, as shown in the figure below.
The airspeed for the best glide, can now be established. It was shown previously that
(39)
Having shown the validity of the drag polar, i.e.,
(40) 
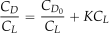
then the ratio  can be written as
(41) 
Differentiating the previous expression with respect to  gives
gives
(42) 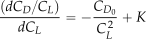
which must be equal to zero for a maximum or minimum. Therefore, the value of corresponding to the best glide condition is
(43) 
It has been shown previously that
(44) 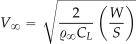
and substituting the value of  from Eq. 43 gives
(45) 
Minimum Sink Condition
The airspeed for the minimum sink condition can also be established. It was shown previously that
(46)
Using the drag polar as before gives
(47) 
Differentiating with respect to gives
(48) 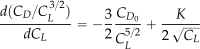
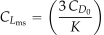
which is equal to zero for a maximum or minimum. Therefore, the value of corresponding to the minimum sink rate is
(49) 
Using again that
(50)
and substituting the value of  from Eq. 49 gives
(51) 
The preceding result shows that the airspeed for the minimum rate of descent (minimum sink rate) depends on the square root of weight and is inversely proportional to the square root of the air density, all other factors being the same. Remember that this flight condition will minimize the time to descend or maximize the time aloft in still air. It will also be the condition to maximize the rate of climb in rising air during soaring, such as circling in a thermal. However, as noted previously, this airspeed is close to the stall speed, so the sailplane must be flown with precision.
Check Your Understanding #2 – Determining the best-soaring airspeed
A sailplane is soaring in thermals at an altitude where  = 1.11 kg/m3. It has a mass of 580 kg and a wing area of 14.4 m2. The drag polar is given by
  . Estimate the best airspeed for soaring.
Show solution/hide solution.
The best airspeed for soaring will be the minimum sink airspeed, , which is given by
![\[ V_{\rm ms} = \left( \frac{2}{\varrho_{\infty}} \right)^{1/2} \left( \frac{K}{3 C_{D_{0}}} \right)^{1/4} \left( \frac{W}{S} \right)^{1/2} \]](https://eaglepubs.erau.edu/app/uploads/quicklatex/quicklatex.com-d418735520c1eae347f5422c0b257d00_l3.svg "Rendered by QuickLaTeX.com")
Substituting the known values gives
![\[ V_{\rm ms} = \left( \frac{2}{1.11} \right)^{1/2} \left( \frac{0.015}{3 \times 0.008} \right)^{1/4} \left( \frac{580 \times 9.81}{14.4} \right)^{1/2} = 24.8\mbox{m/s} \approx 47.8~\mbox{kts} \]](https://eaglepubs.erau.edu/app/uploads/quicklatex/quicklatex.com-a80d0b651dd01d404769c8b589439351_l3.svg "Rendered by QuickLaTeX.com")
Airfoils for Sailplanes
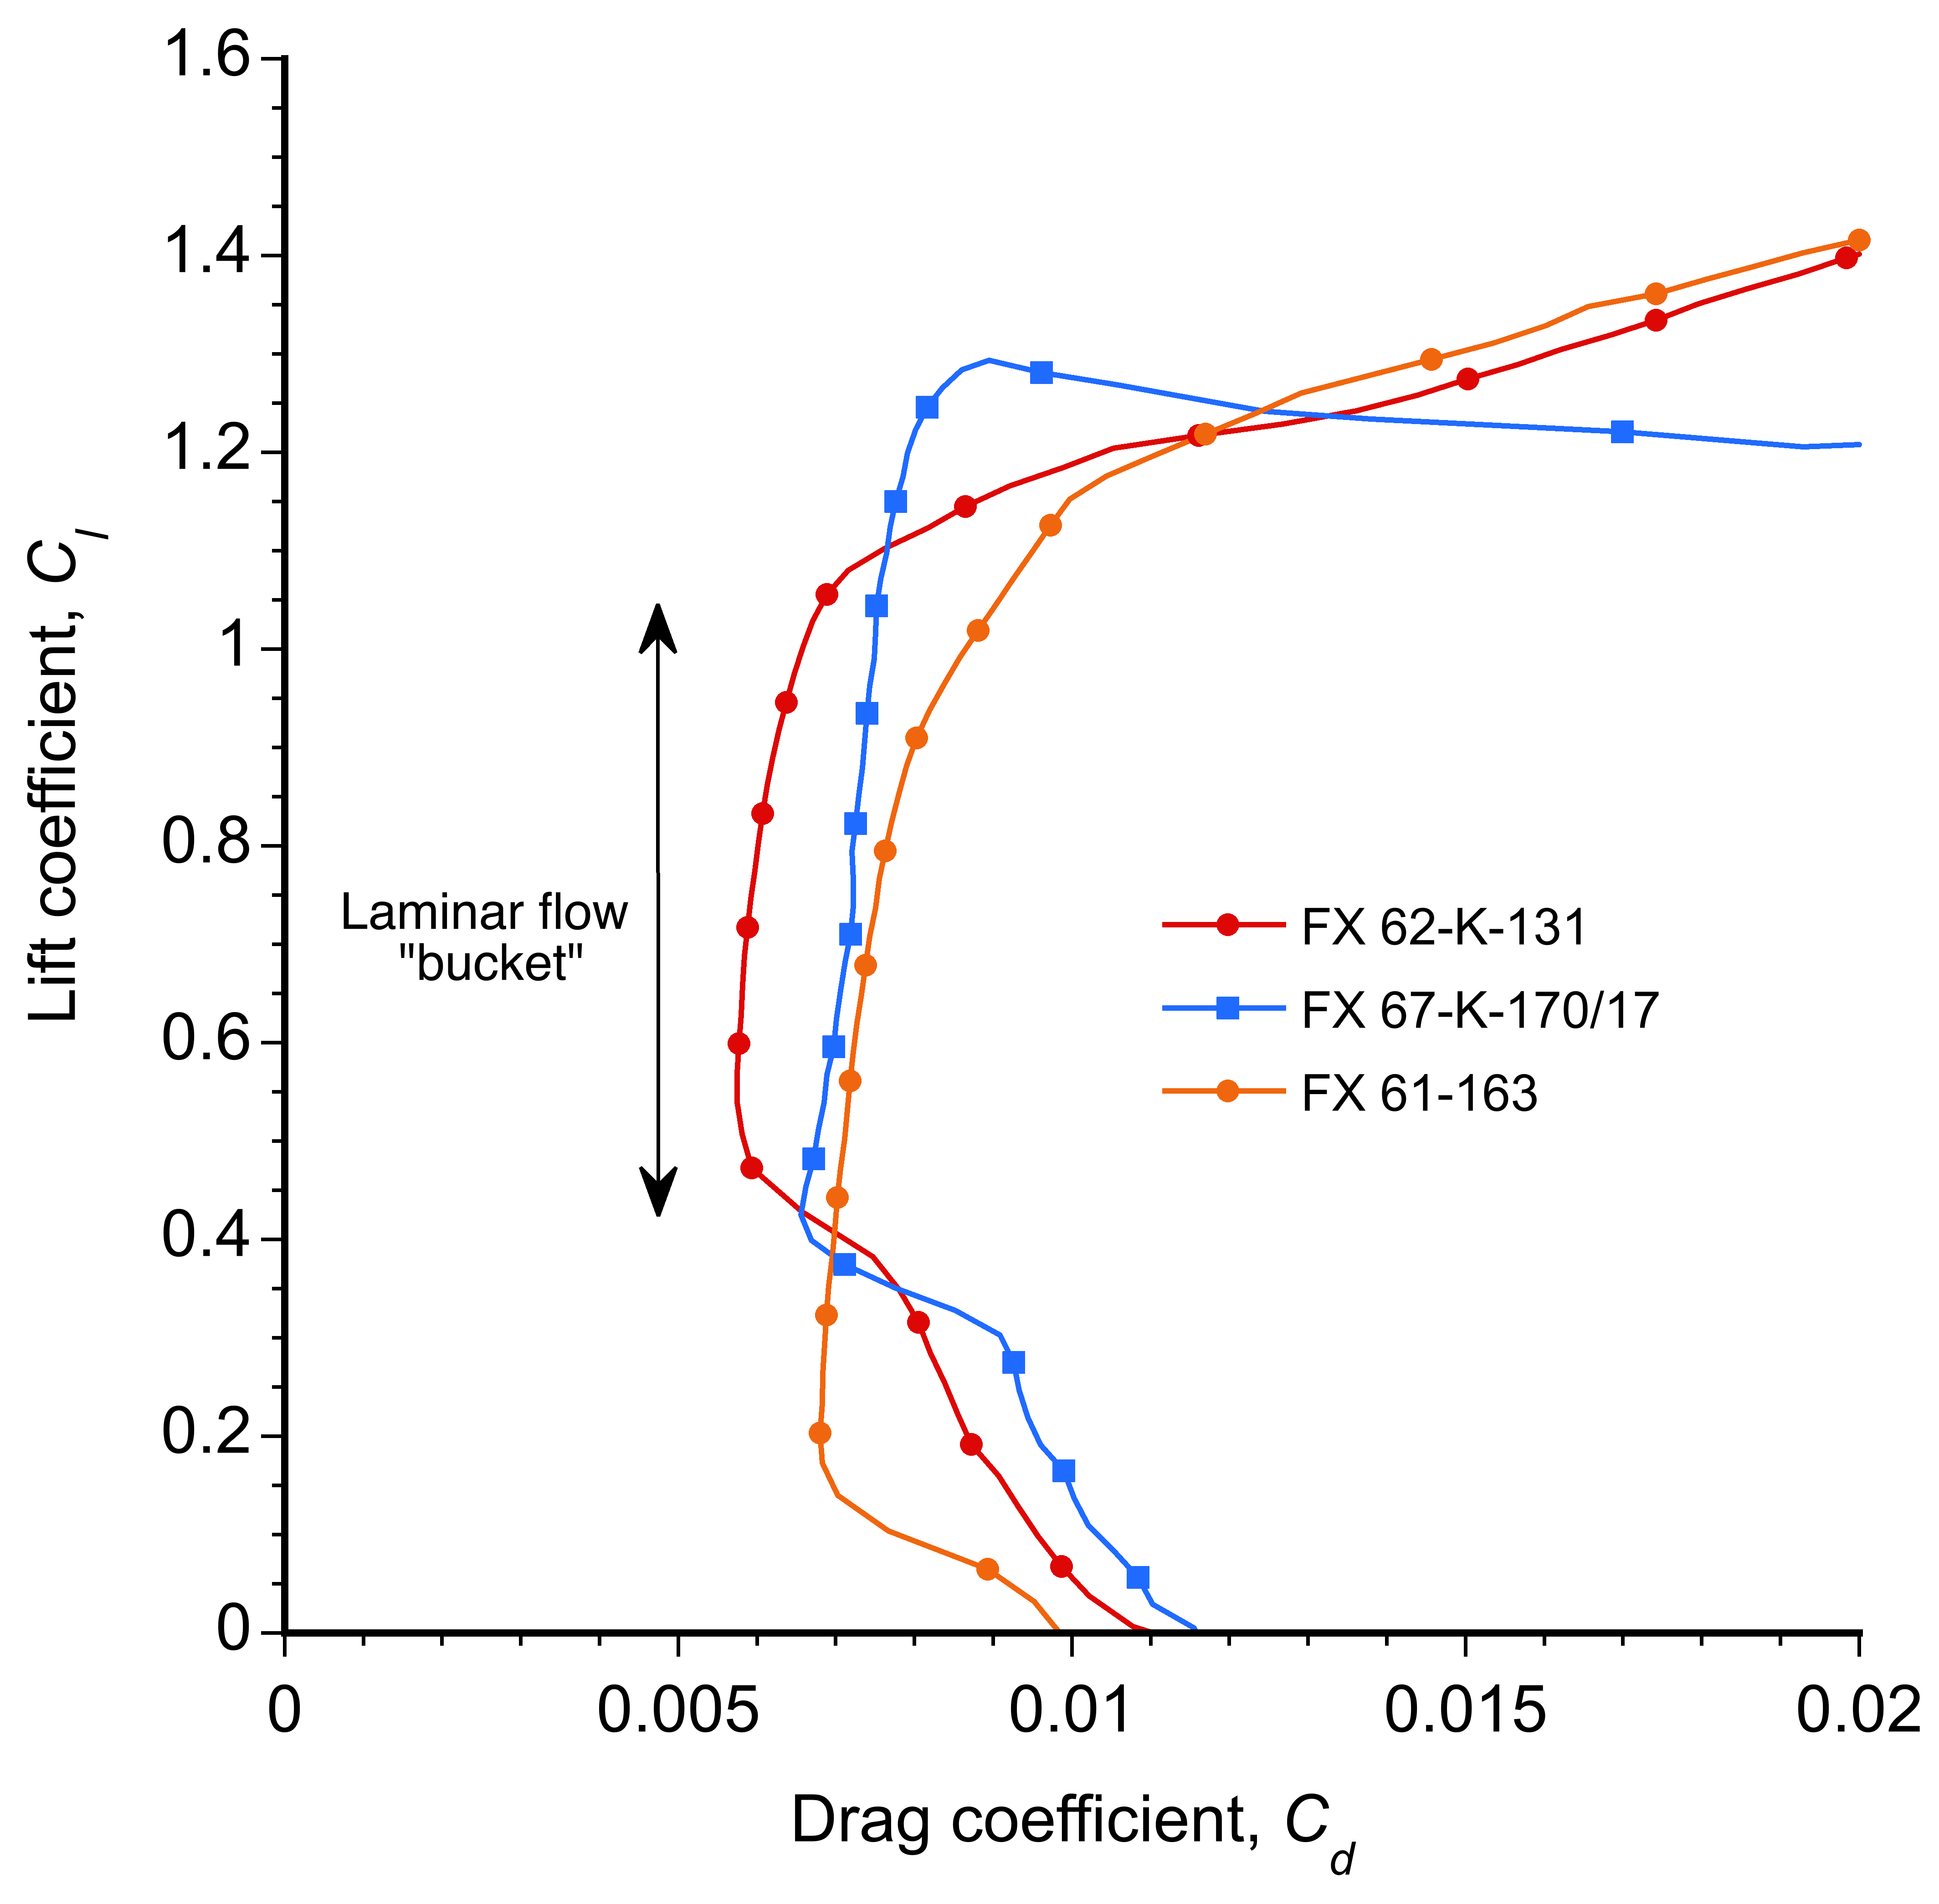
Sailplanes use laminar flow airfoils, which are designed to maximize the extent of the laminar boundary layer over the leading edge of the airfoil, hence substantially reducing skin friction drag, i.e., the value. These airfoils produce low-drag “buckets” at low angles of attack and low lift coefficients. A series of airfoils called the FX-airfoils have been designed explicitly for sailplane applications by Franz Xaver “FX” Wortmann, examples being shown in the figure below. The geometric shapes of these airfoils are different from those used on most airplanes and are designed to have a point of maximum thickness close to half-chord. This shape produces a favorable pressure gradient over the leading edge, encouraging the boundary layer to be laminar for longer. The downside is that such airfoils typically produce lower values of maximum lift coefficient, i.e., a stall occurs at lower angles of attack.
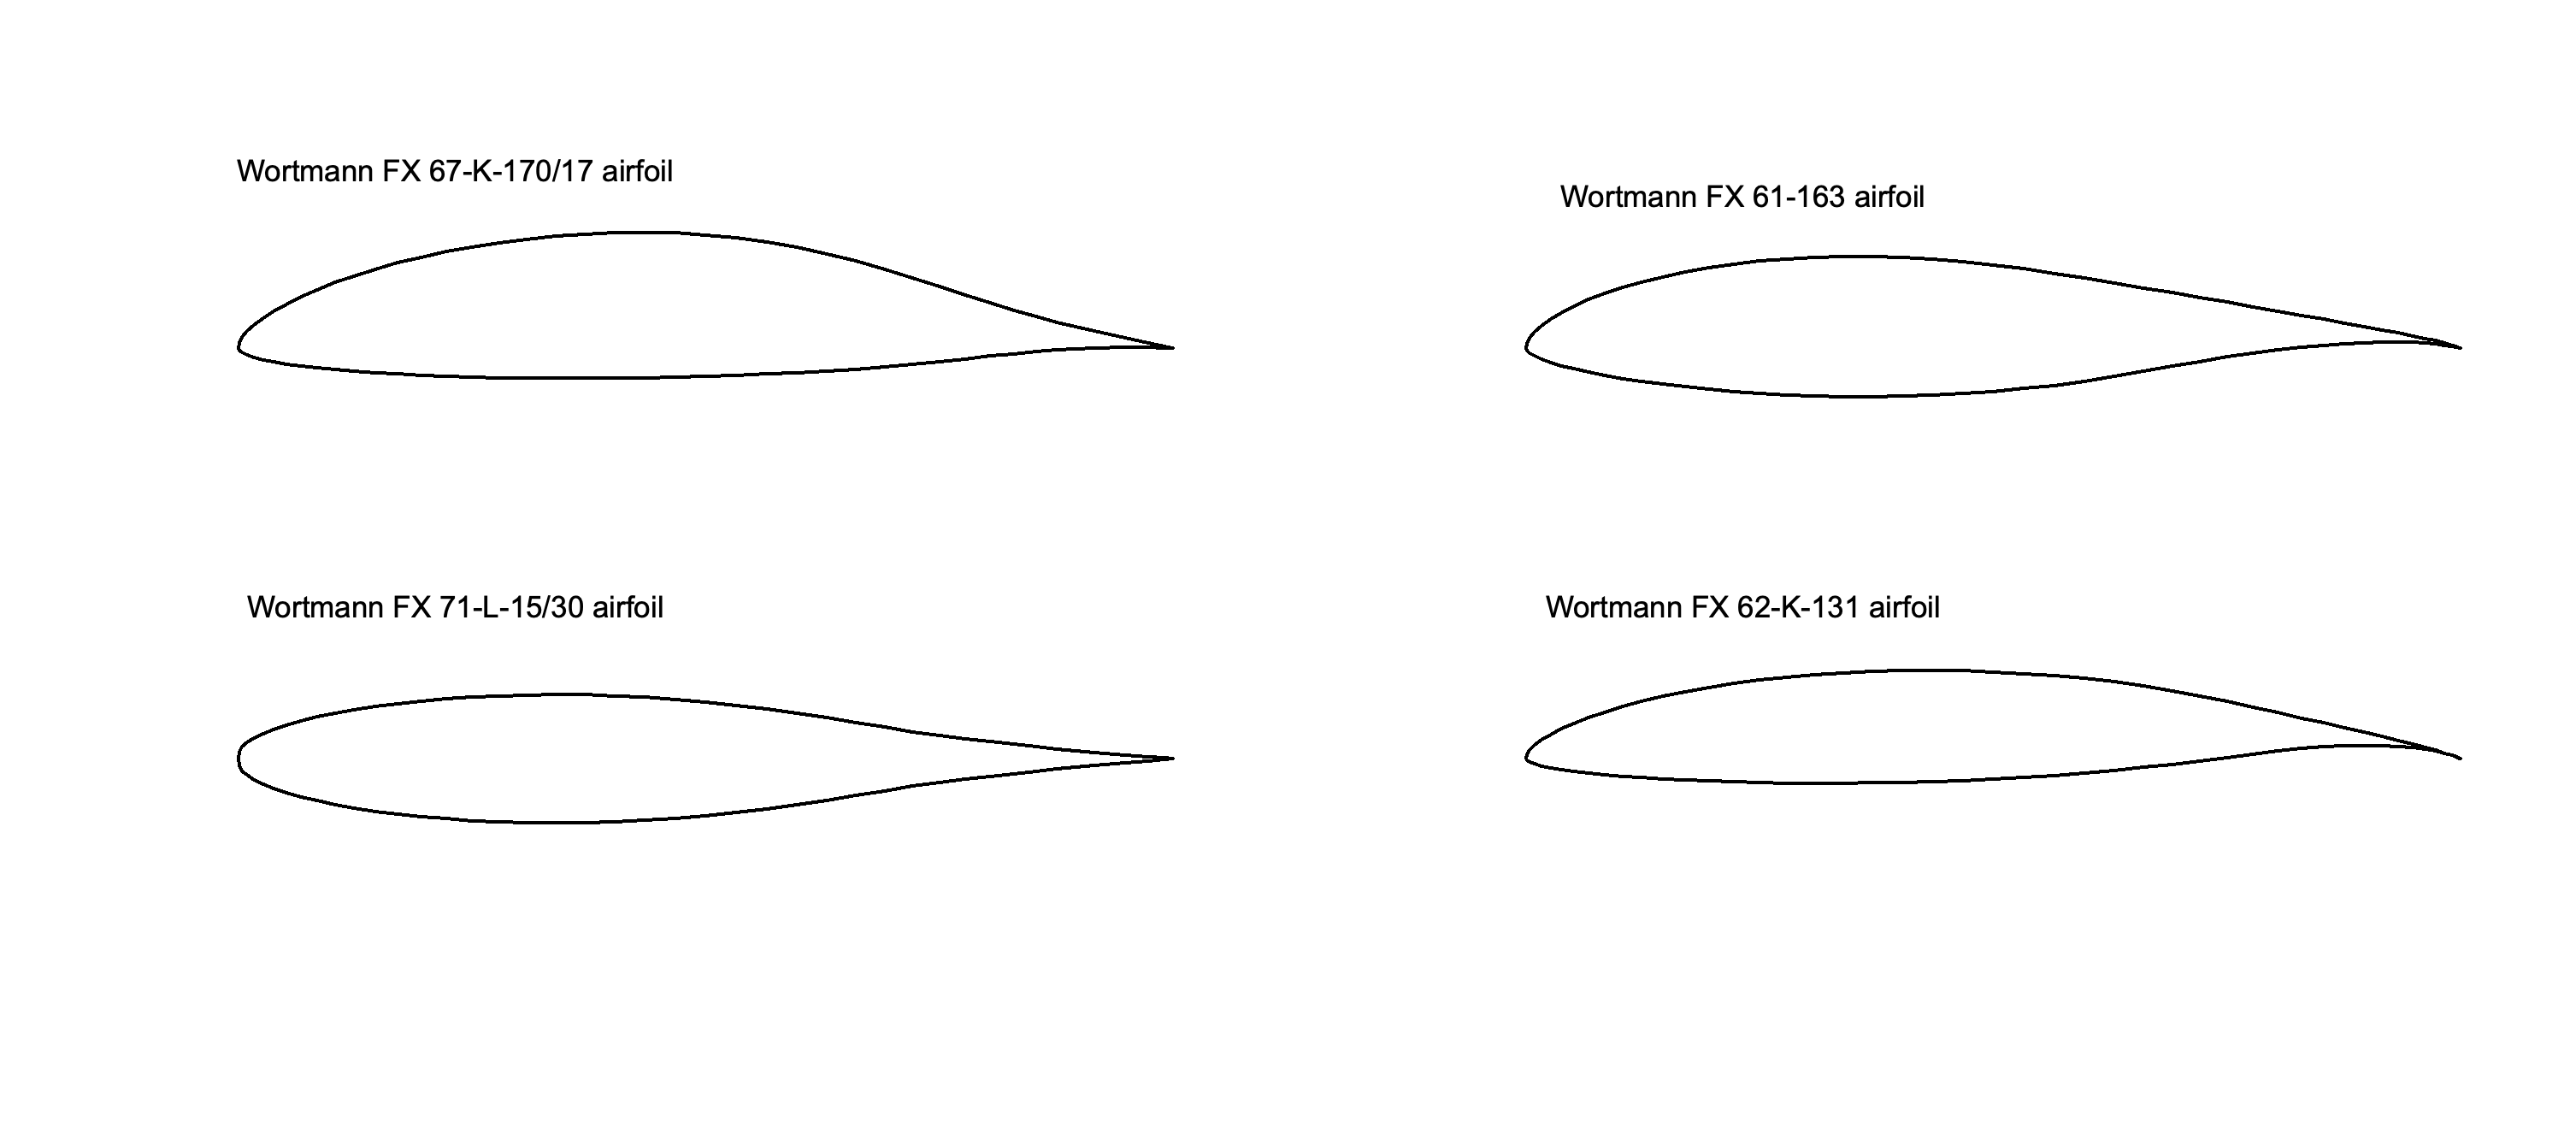
The Wortmann airfoils have a specific numbering system. The first two digits stand for the year the airfoil was designed, e.g., FX 61-163 was designed in 1961, and it is notable in that it has been used on many of the first-generation glass fiber sailplanes. Then, one or two optional letters may follow, which specify the use of the airfoil. For example, the “K” stands for “Klappenprofil” in German, which translates to “flap profile, so these are airfoils specifically designed for applications that involve flaps or ailerons. The “L” stands for “Leitwerk,” the German name for tail surfaces or the empennage, so the FX 71-L-150/30 is a symmetric airfoil. The next three digits denote the relative thickness, so “150” means this airfoil has a 15% thickness-to-chord ratio. The last digits (if present) denote the relative flap or aileron chord as a percent of the chord. For example, the FX 71-L-150/30 is designed to accommodate a flap or aileron over the latter 30% of its chord.
Examples of the drag polars for a few FX airfoils are shown in the figure below. Notice the extensive laminar flow “bucket” where the drag coefficient is extremely low. Indeed, the laminar flow may prevail over the first 50% of the chord in such regions. However, the wings must be kept perfectly smooth by wiping and polishing, and must always be completely clean and free of bugs, etc., for laminar flow to prevail. Any surface roughness, such as bugs or raindrops, quickly destroys a laminar boundary layer. The resulting increase in skin friction drag makes the airfoil perform comparably (or sometimes worse) than a conventional airfoil. This reason is why laminar flow airfoil sections are challenging to use successfully in practice, and sailplane pilots try to avoid flying through rain showers.
Hang Gliders
Hang gliders are perhaps the most primitive form of gliding, but also the purest, an example being shown in the photograph below. It is the closest humans can get to flying like a bird, flight control being obtained by weight-shifting in the manner used by Lilienthal and Pilcher. Hang gliders were derived from the Rogallo wing concept. Francis Rogallo worked for the NACA, and his patented concept was initially developed for spacecraft recovery systems. A delta-shaped Rogallo wing relies on an element of vortex lift; it creates a good amount of lift but has high drag. A hang glider derived from the Rogallo concept is typically made of several aluminum tubes forming a framework over which a flexible fabric wing surface is stretched to create two partial conic surfaces for lift generation, as shown below.
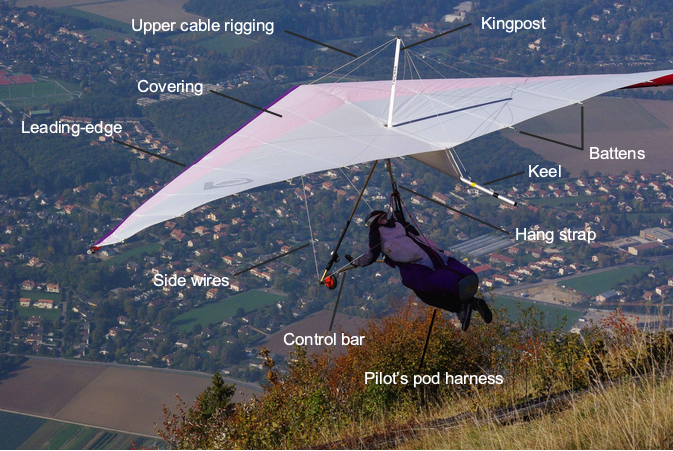
Hang gliders became popular in the 1960s and 1970s because they offered simplicity, affordability, and ease of use. Many enthusiasts experimented with hang-gliders and made significant advancements in understanding how they fly. During the 1970s, the sport of hang gliding experienced a substantial surge in popularity as advancements in materials and technology made such gliders more accessible, less expensive, and safer.
Introducing aluminum alloy frames, Dacron coverings, and improved control systems contributed to developing more efficient and stable hang gliders. Hang gliders are designed to be lightweight and portable. The portability allows pilots to quickly transport and assemble their gliders, enabling them to fly in various locations. Hang gliders are typically launched by foot from a hill or towed into the air by a winch or ground-based vehicle.
The gliding polar for a hang glider can be estimated using the same principles and assumptions used for a conventional glider. Recall that the lift coefficient is
(52)
where is the wing loading. The corresponding drag coefficient comes from the assumed polar, i.e.,
(53)
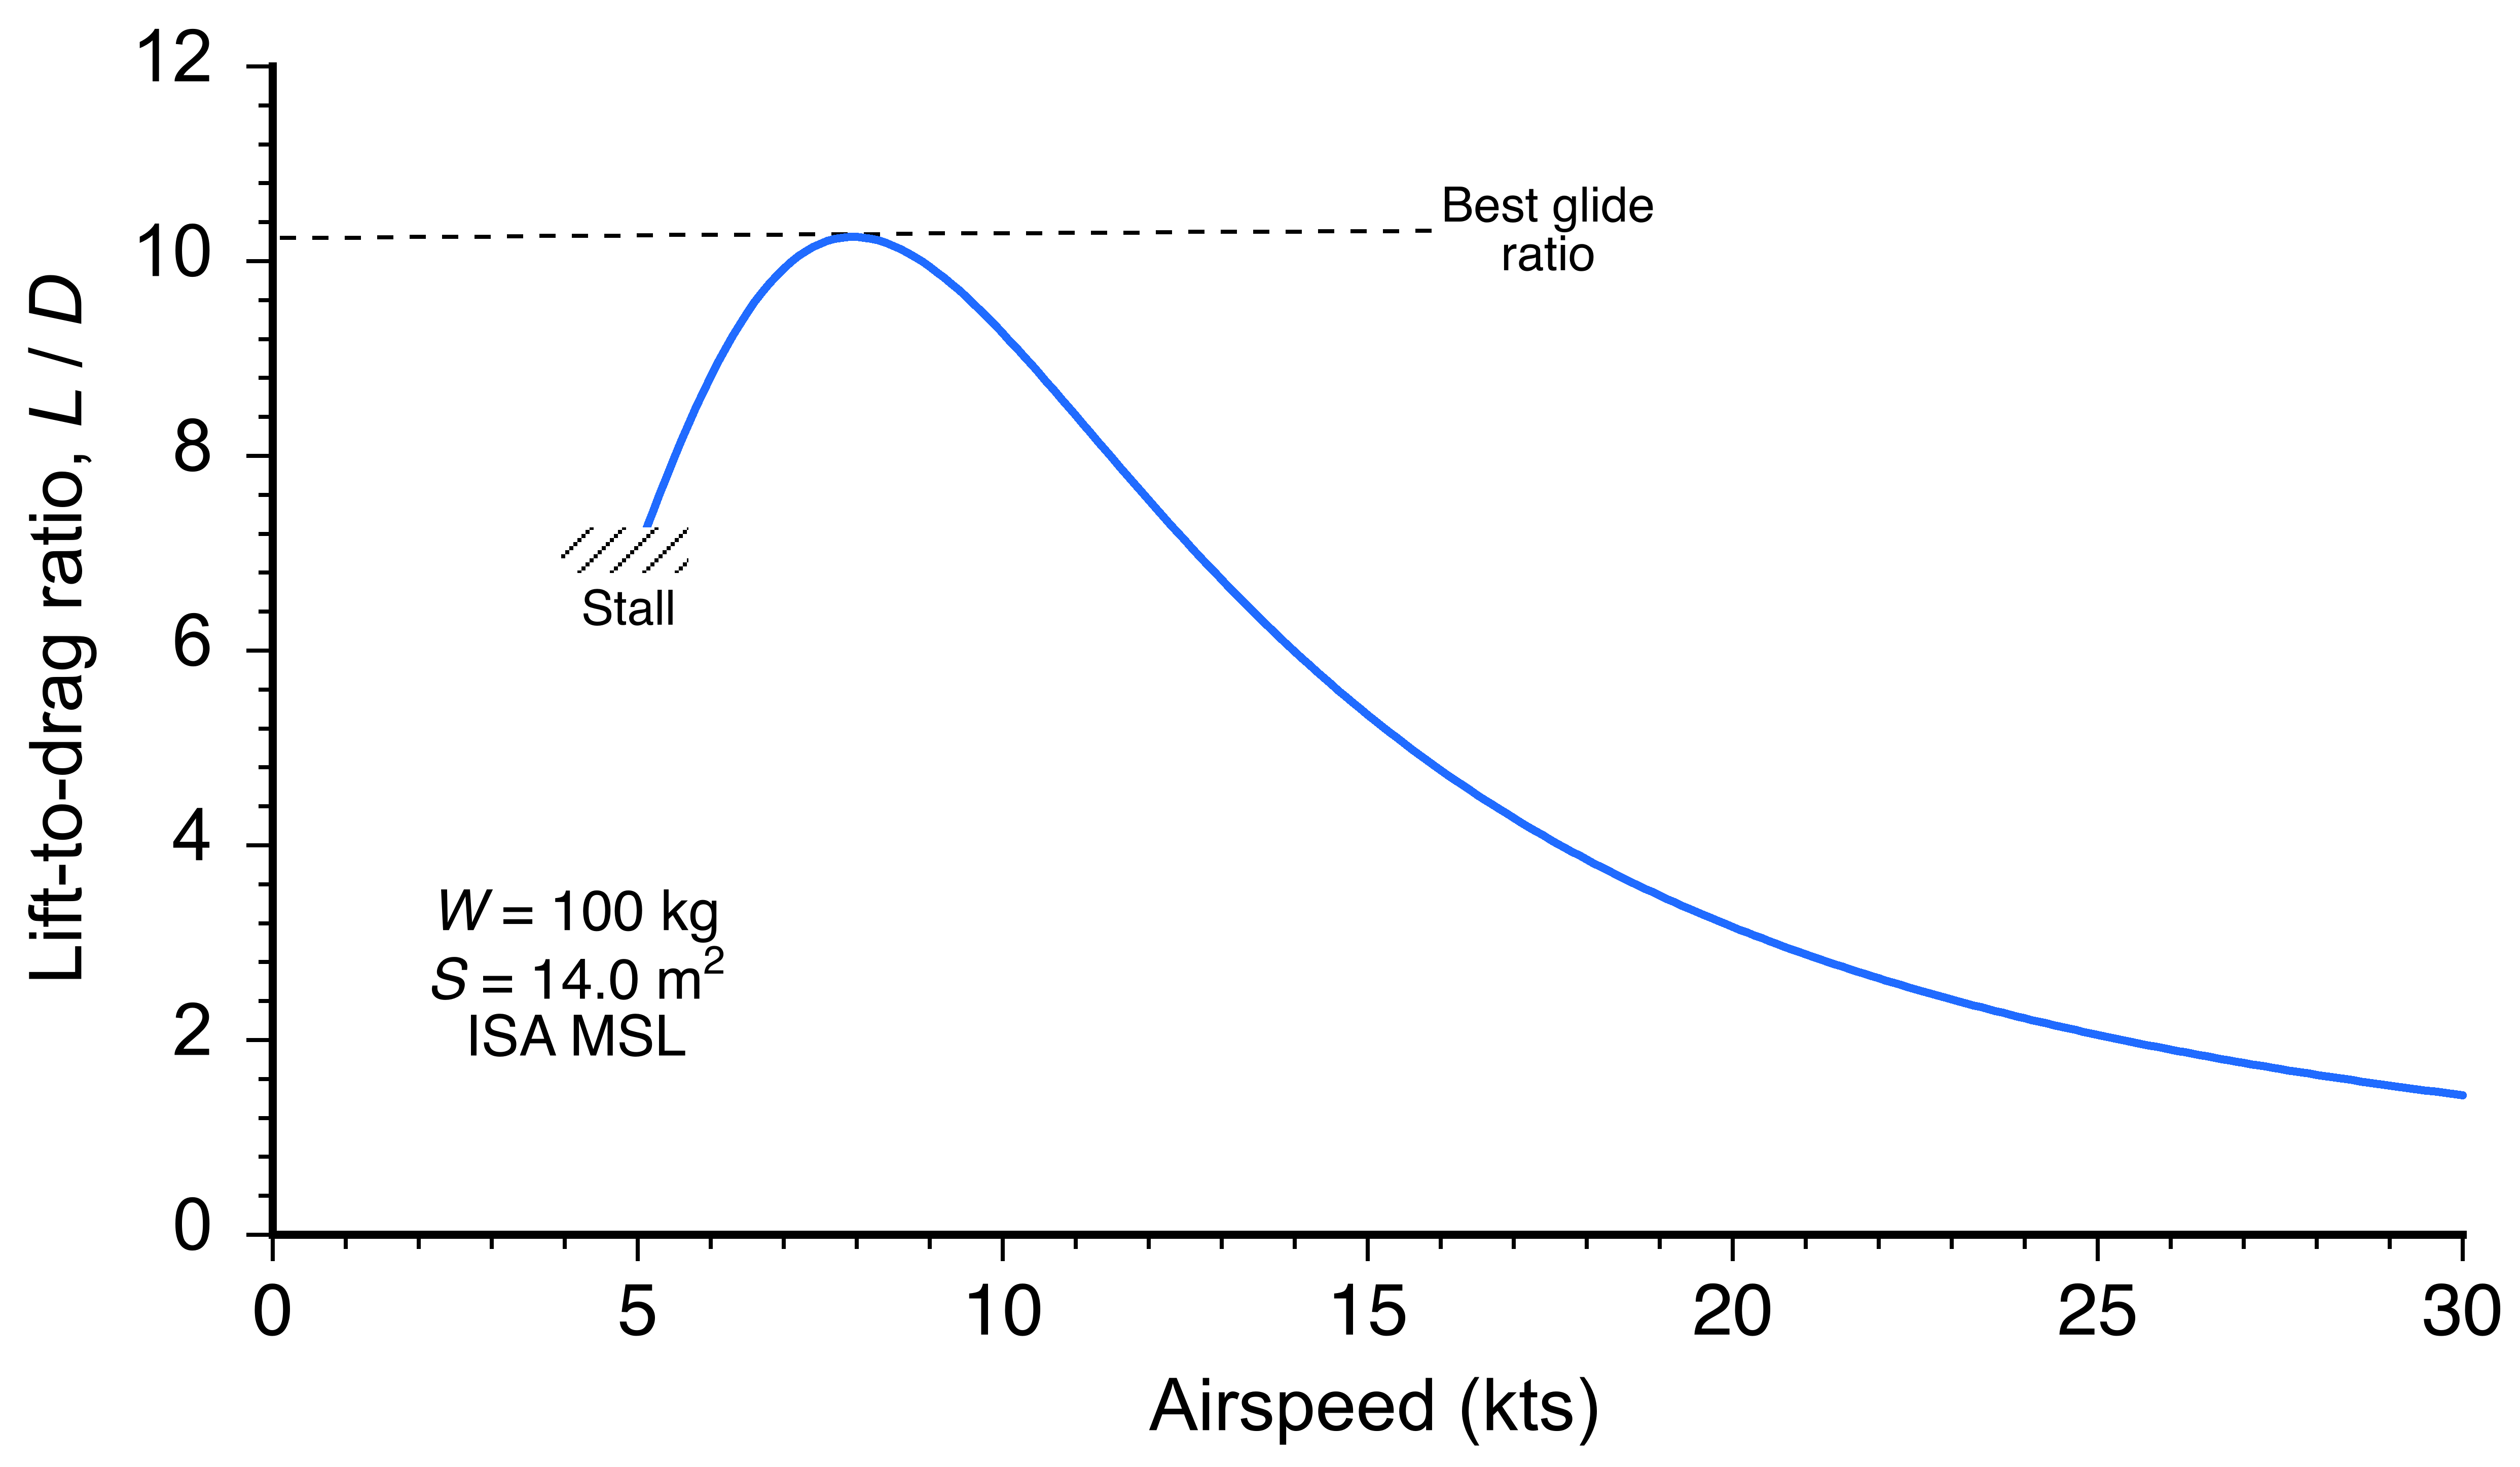
which for a first-generation hang glider has representative values of = 0.034 and = 0.07. These values are significantly higher than for a conventional sailplane, which would be expected based on a hang glider’s relatively low aspect ratio and open configuration. The resulting lift-to-drag ratio of a hang glider is about 10, as shown in the figure below, so it is quite poor compared to even the lowest-performance sailplanes. Notice also that the lift-to-drag ratio is very “peaky” because the performance drops off very quickly above a certain airspeed, about 8 kts in this case.
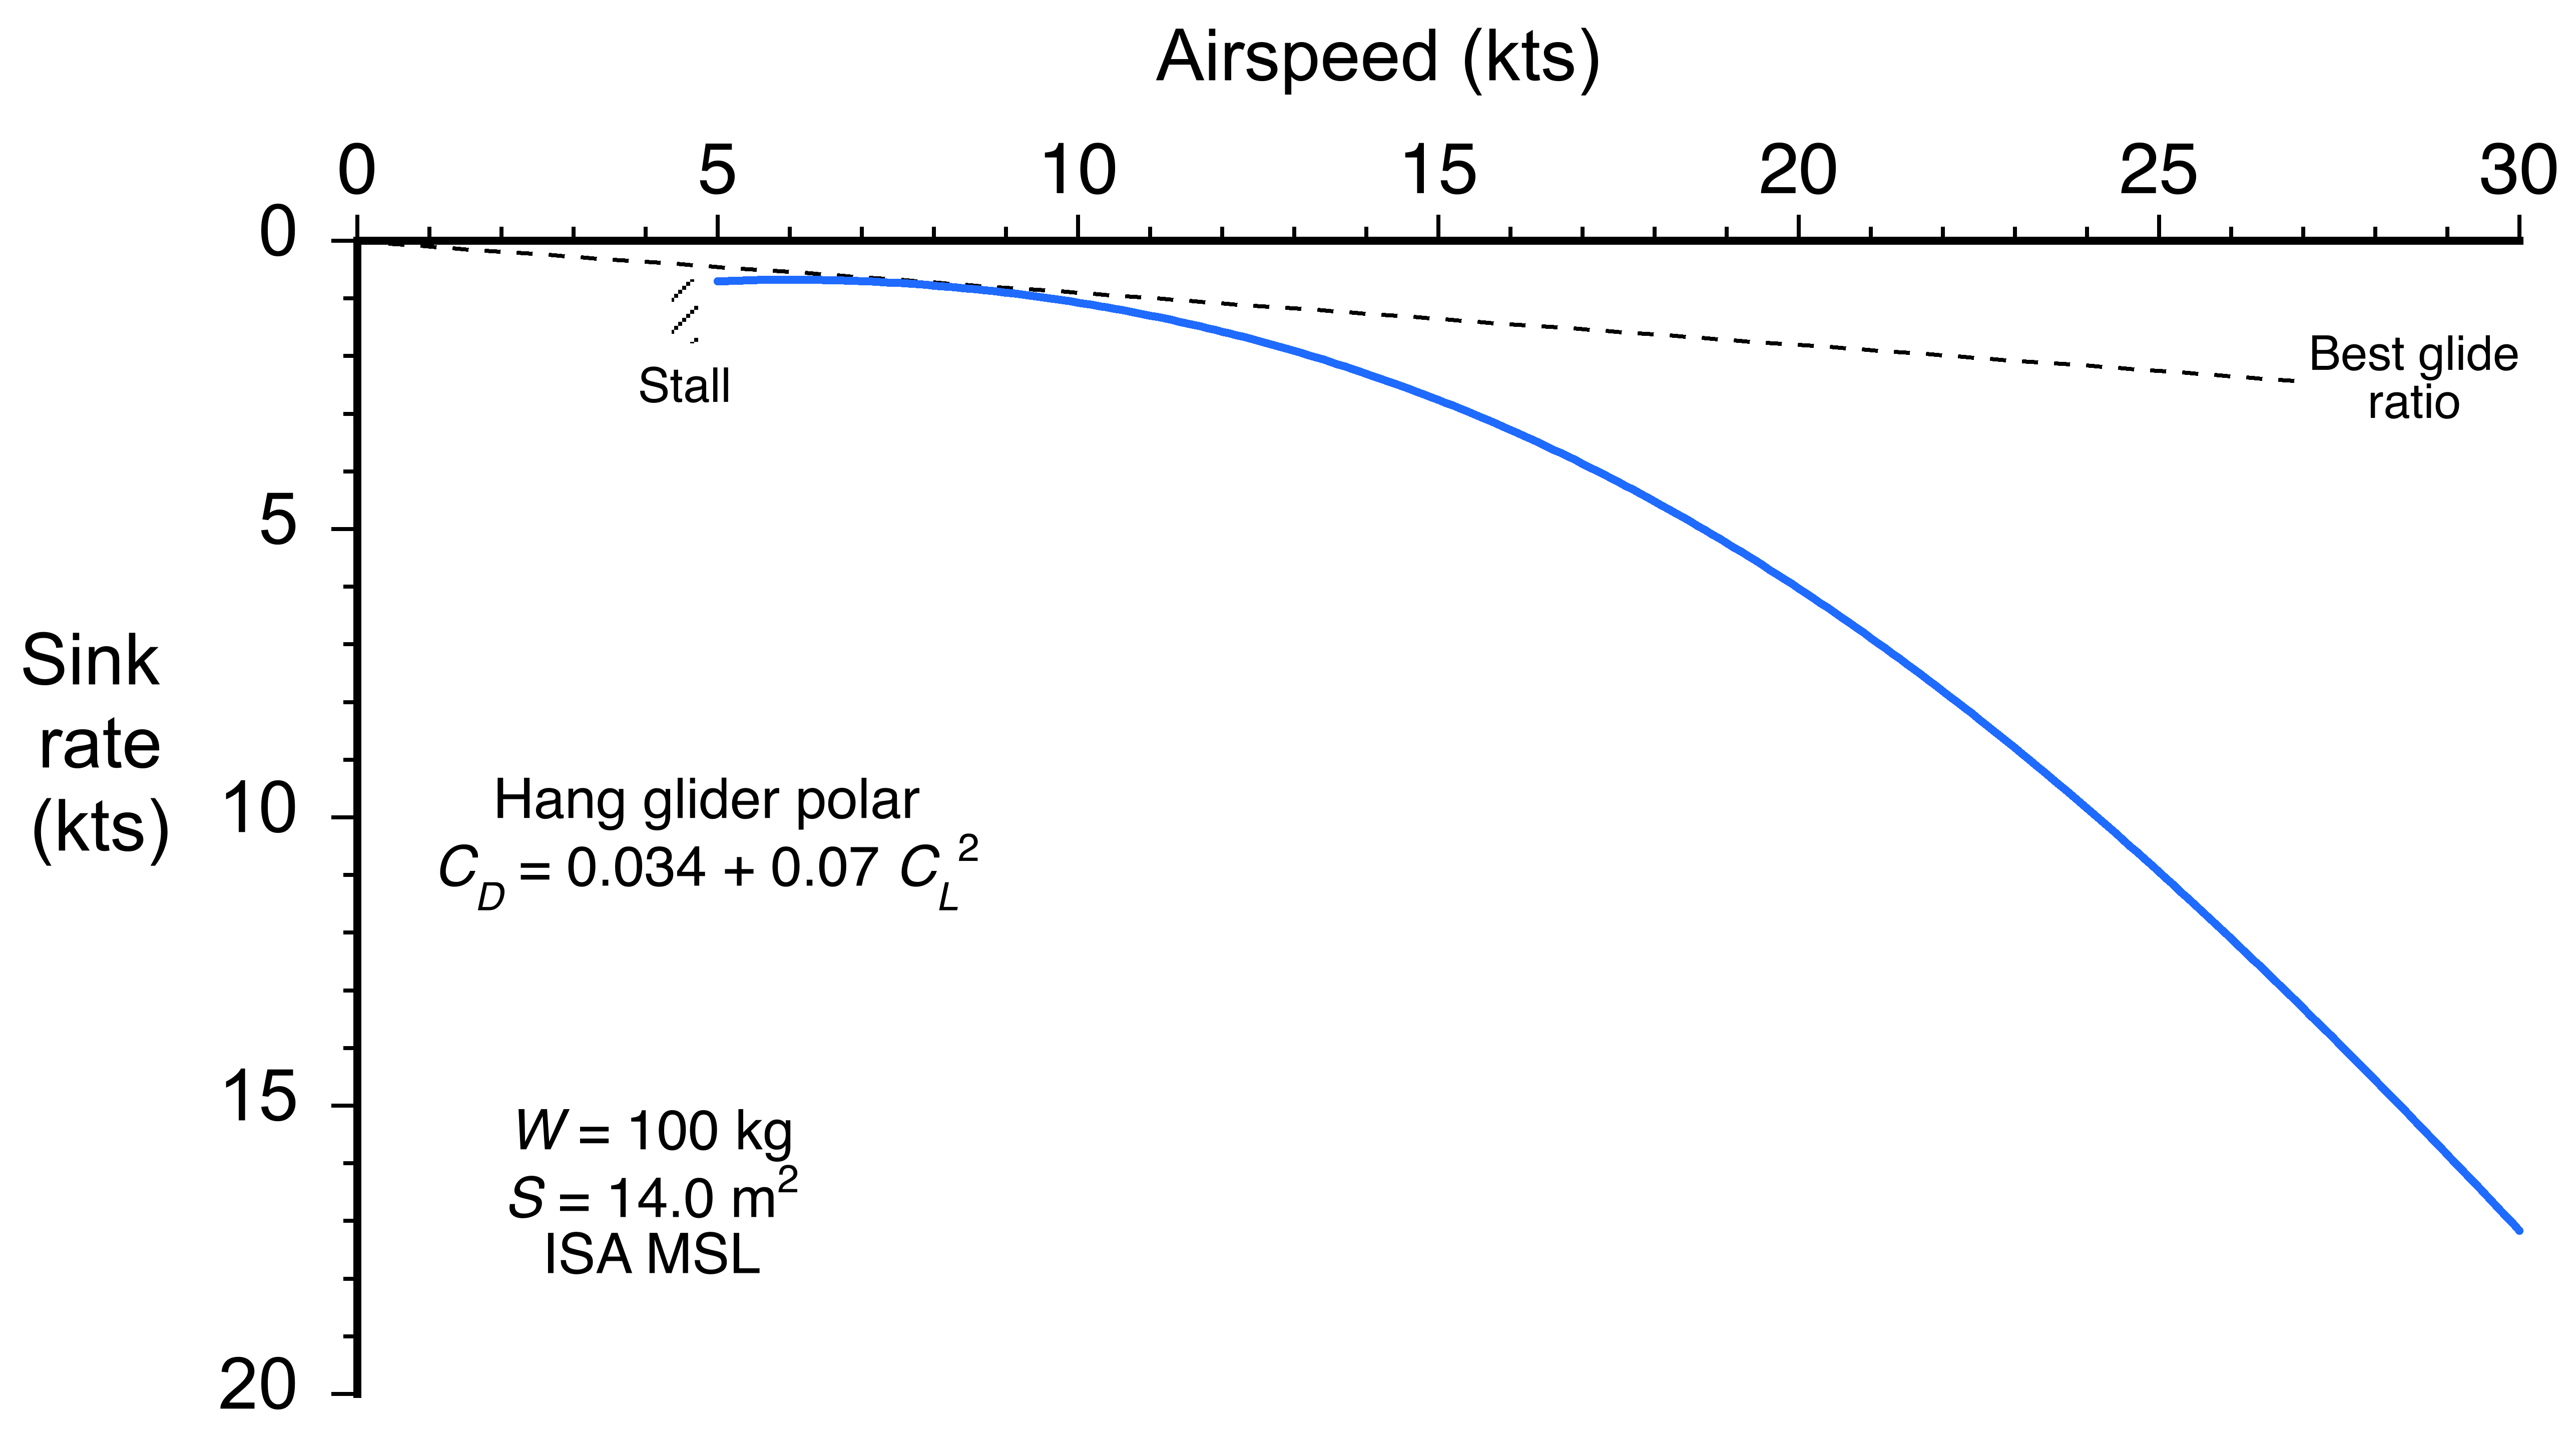
The corresponding gliding polar is shown in the figure below. The best glide ratio is relatively poor, about 10, but this is the price to pay for such a basic glider concept. However, hang gliders have relatively low sink rates because of their lightweight construction. Lower sink rates are desirable as they allow the hang glider to stay airborne in weaker updraft conditions, such as from thermals or ridge lift. Hang gliders generally have sink rates ranging from 150 to 400 ft/min or 0.75 to 2 m/s.
While hang gliders of today will use updated variations of the Rogallo design, including higher aspect ratio wings, Rogallo’s influence on hang gliding remains significant. Hang gliders have continued to evolve with advancements in materials like carbon fiber composites, further enhancing performance because of their lightweight design. Features like reserve parachutes and improved harness systems have been introduced, improving pilot safety.
Atmospheric Energy Sources for Soaring Flight
Soaring is made possible by pilots flying their gliders skillfully and efficiently to exploit naturally occurring upward motions in the atmosphere. These vertical currents originate from three principal mechanisms: thermal lift, ridge lift, and wave lift. Distinct thermodynamic and aerodynamic principles govern each mechanism. Thermal lift arises from surface heating that generates buoyant plumes in an unstable atmosphere, where rising air parcels cool adiabatically but remain warmer than their surroundings. Ridge lift is created when horizontal winds are deflected upward by sloping terrain, producing a persistent updraft along the windward face of a hill or ridge; its energy source is the interaction between the kinetic energy in the wind flow and the topography rather than thermal gradients. Wave lift, in contrast, occurs in a stably stratified atmosphere when elevated terrain initiates vertically propagating oscillations known as mountain or lee waves. These standing waves store energy and can extend to stratospheric altitudes. All three mechanisms provide usable energy for unpowered flight but differ in spatial structure, duration, and the altitude ranges over which lift is available.
Thermodynamics of Thermals
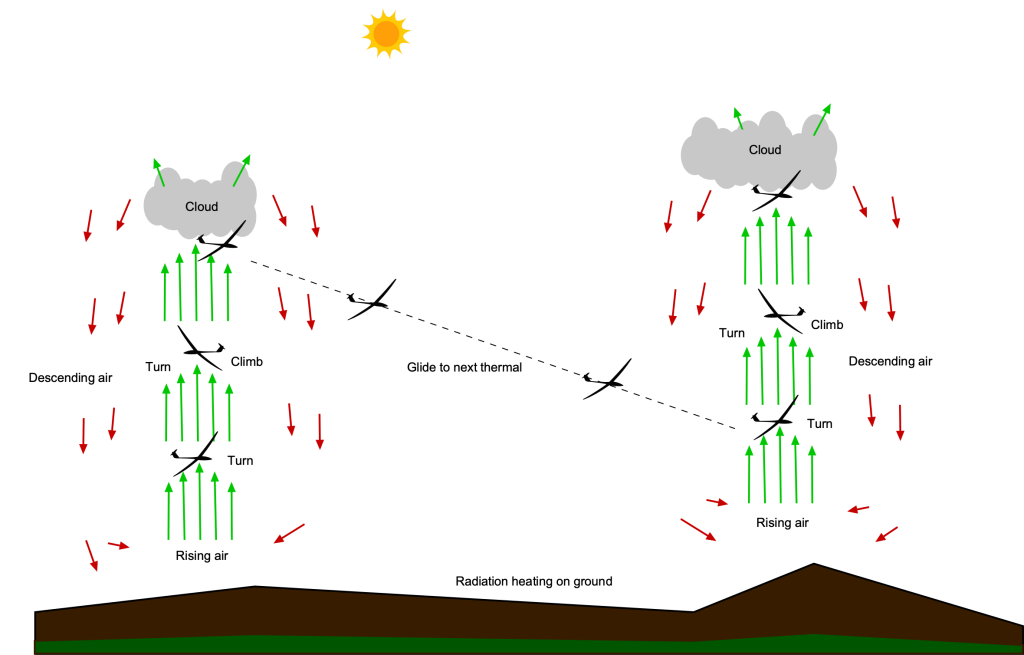
Thermals are buoyant plumes of air arising from localized surface heating and represent the most common means of sustaining soaring flight. Their dynamics are governed by dry atmospheric thermodynamics, hydrostatic balance, and the local stability of the ambient air. When solar radiation heats the ground unevenly, adjacent air warms and may become buoyant enough to rise. The resulting vertical motion is driven by the temperature contrast between the rising parcel and its environment. Gliders often circle within one thermal to gain altitude and so potential energy, then glide forward using that energy to reach another thermal, repeating the process as long as convective conditions persist.
Assuming a dry, compressible, ideal gas atmosphere in hydrostatic equilibrium, the vertical temperature profile is characterized by the environmental lapse rate, i.e.,
(54) 
A rising unsaturated parcel cools at the dry adiabatic lapse rate based on
(55) 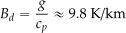
where  is gravitational acceleration and
  the specific heat at constant pressure. The parcel’s buoyant acceleration per unit mass is approximated by the Boussinesq relation, i.e.,
(56) 
Thermal instability arises when  , so that upward-displaced parcels are less dense than their surroundings and continue to rise. The vertical velocity within the thermal evolves from the integrated buoyant acceleration and entrainment losses, i.e.,
(57) 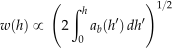
In practice, entrainment of cooler ambient air reduces the buoyancy with height, limiting the thermal’s vertical extent.
The glider’s total specific mechanical energy (per unit weight) is
(58) 
where  is the airspeed and the altitude. Its time derivative is
(59) 
where is the weight of the glider and its it lift-to-drag ratio. Notice that it can be assumed that  = (lift = wight). Assuming a steady thermal,
  , and the energy gain comes from vertical lift alone. If
  is the glider’s sink rate in still air and
  is the thermal’s vertical velocity, then
(60) 
so that
(61) 
Alternatively, the balance can be expressed as
(62) 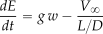
so the higher the lift-to-drag ratio the more efficient the glider will be in using the thermal updraughts. To maintain altitude, then  . To this end, a nondimensional themalling efficiency ratio can be defined as
(63) 
where values of  indicate a net energy gain.
When a sailplane reaches the cloudbase, then this represents the usable extent of the thermal; flying in the clouds is ill advised. Typical thermals encountered in soaring conditions exhibit core velocities of the order of  to
to  (
( to
to  ), diameters of 100 to 400 m (about 300 ft to 1,200 ft), and lifespans of several minutes to tens of minutes. Glider pilots will turn tightly to remain near the strongest updraft part of the thermal to maximize the rate of climb. A skilled pilot may be able to stay aloft using thermals for many hours and cover great distances.
Aerodynamics of Ridge Lift
Ridge lift occurs when horizontal wind encounters sloping terrain and is deflected upward, producing a steady updraft along the windward face. The flow is redirected by the terrain rather than thermodynamic effects. In inviscid, irrotational, incompressible flow, a wind of speed  rising along a slope of angle
  produces a vertical velocity scaling as
  . This lift region is strongest near the slope and extends a few hundred meters outward, depending on terrain geometry and wind speed.
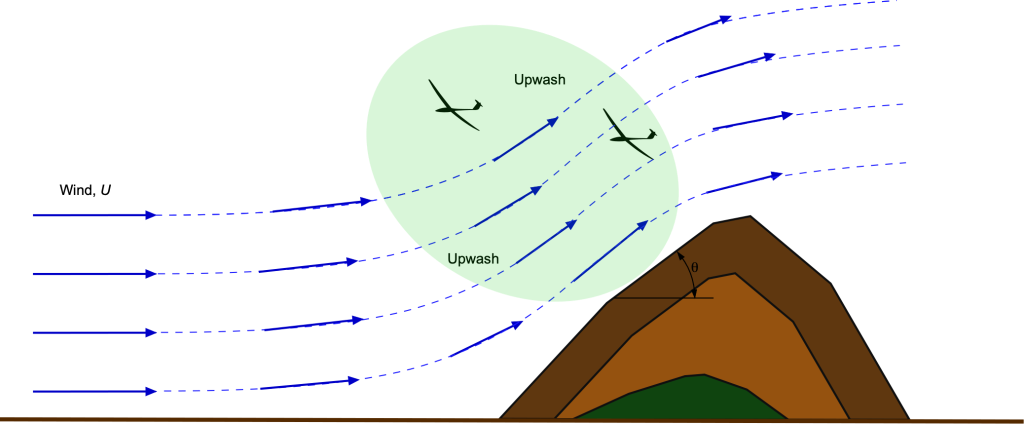
Unlike thermals, ridge lift does not involve buoyancy; the energy source is the kinetic energy of the horizontal wind. The airmass remains nearly isentropic, and the glider gains altitude by extracting mechanical work from the redirected flow. The glider’s energy balance remains as
(64)
provided that the flow is steady. In this case, the condition for level flight remains, i.e., , and the minimum required vertical velocity is
(65) 
Therefore, gliders with higher glide ratios can sustain flight in weaker ridge lift. Ridge lift is reliable and easy to exploit near continuous ridgelines with strong crosswinds but is limited in vertical extent and dependent on terrain-following flight.
The strength and reliability of ridge lift depend on several factors: wind speed and direction, terrain slope and shape, and atmospheric stability. Stable stratification enhances flow adherence to terrain and maintains laminar conditions favorable for soaring, while unstable conditions may produce turbulence and interfere with coherent updrafts. Orographic clouds may form if the air is sufficiently humid. Ridge lift is typically limited in altitude to the height of the terrain or just above. However, when conditions permit, it can be an entry point to higher-altitude lift mechanisms such as wave systems.
Ridge soaring is especially effective in regions with continuous ridgelines and consistent crosswind components. It offers reliable, sustained lift and is often used for long cross-country flights along mountainous terrain. Compared to thermal or wave soaring, ridge lift is more localized but easier to exploit to sustain altitude at low to mid-levels.
Thermodynamics of Wave Soaring
Wave soaring is a flight technique that exploits large-scale, vertically oscillating motions in the atmosphere known as mountain waves or lee waves, as shown in the figure below. These waves form when stable air is forced over a topographic barrier, such as a mountain ridge, and then undergoes oscillatory vertical displacements downstream that can persist for great distances. Unlike thermals, which depend on atmospheric instability and convective buoyancy, wave systems rely on atmospheric stability to store and propagate energy vertically in the form of standing waves. The crests of lee waves are often marked by smooth lenticular or lens-shaped clouds. In the shear layers, turbulence and rotating flows are produced, usually called “rotor.”
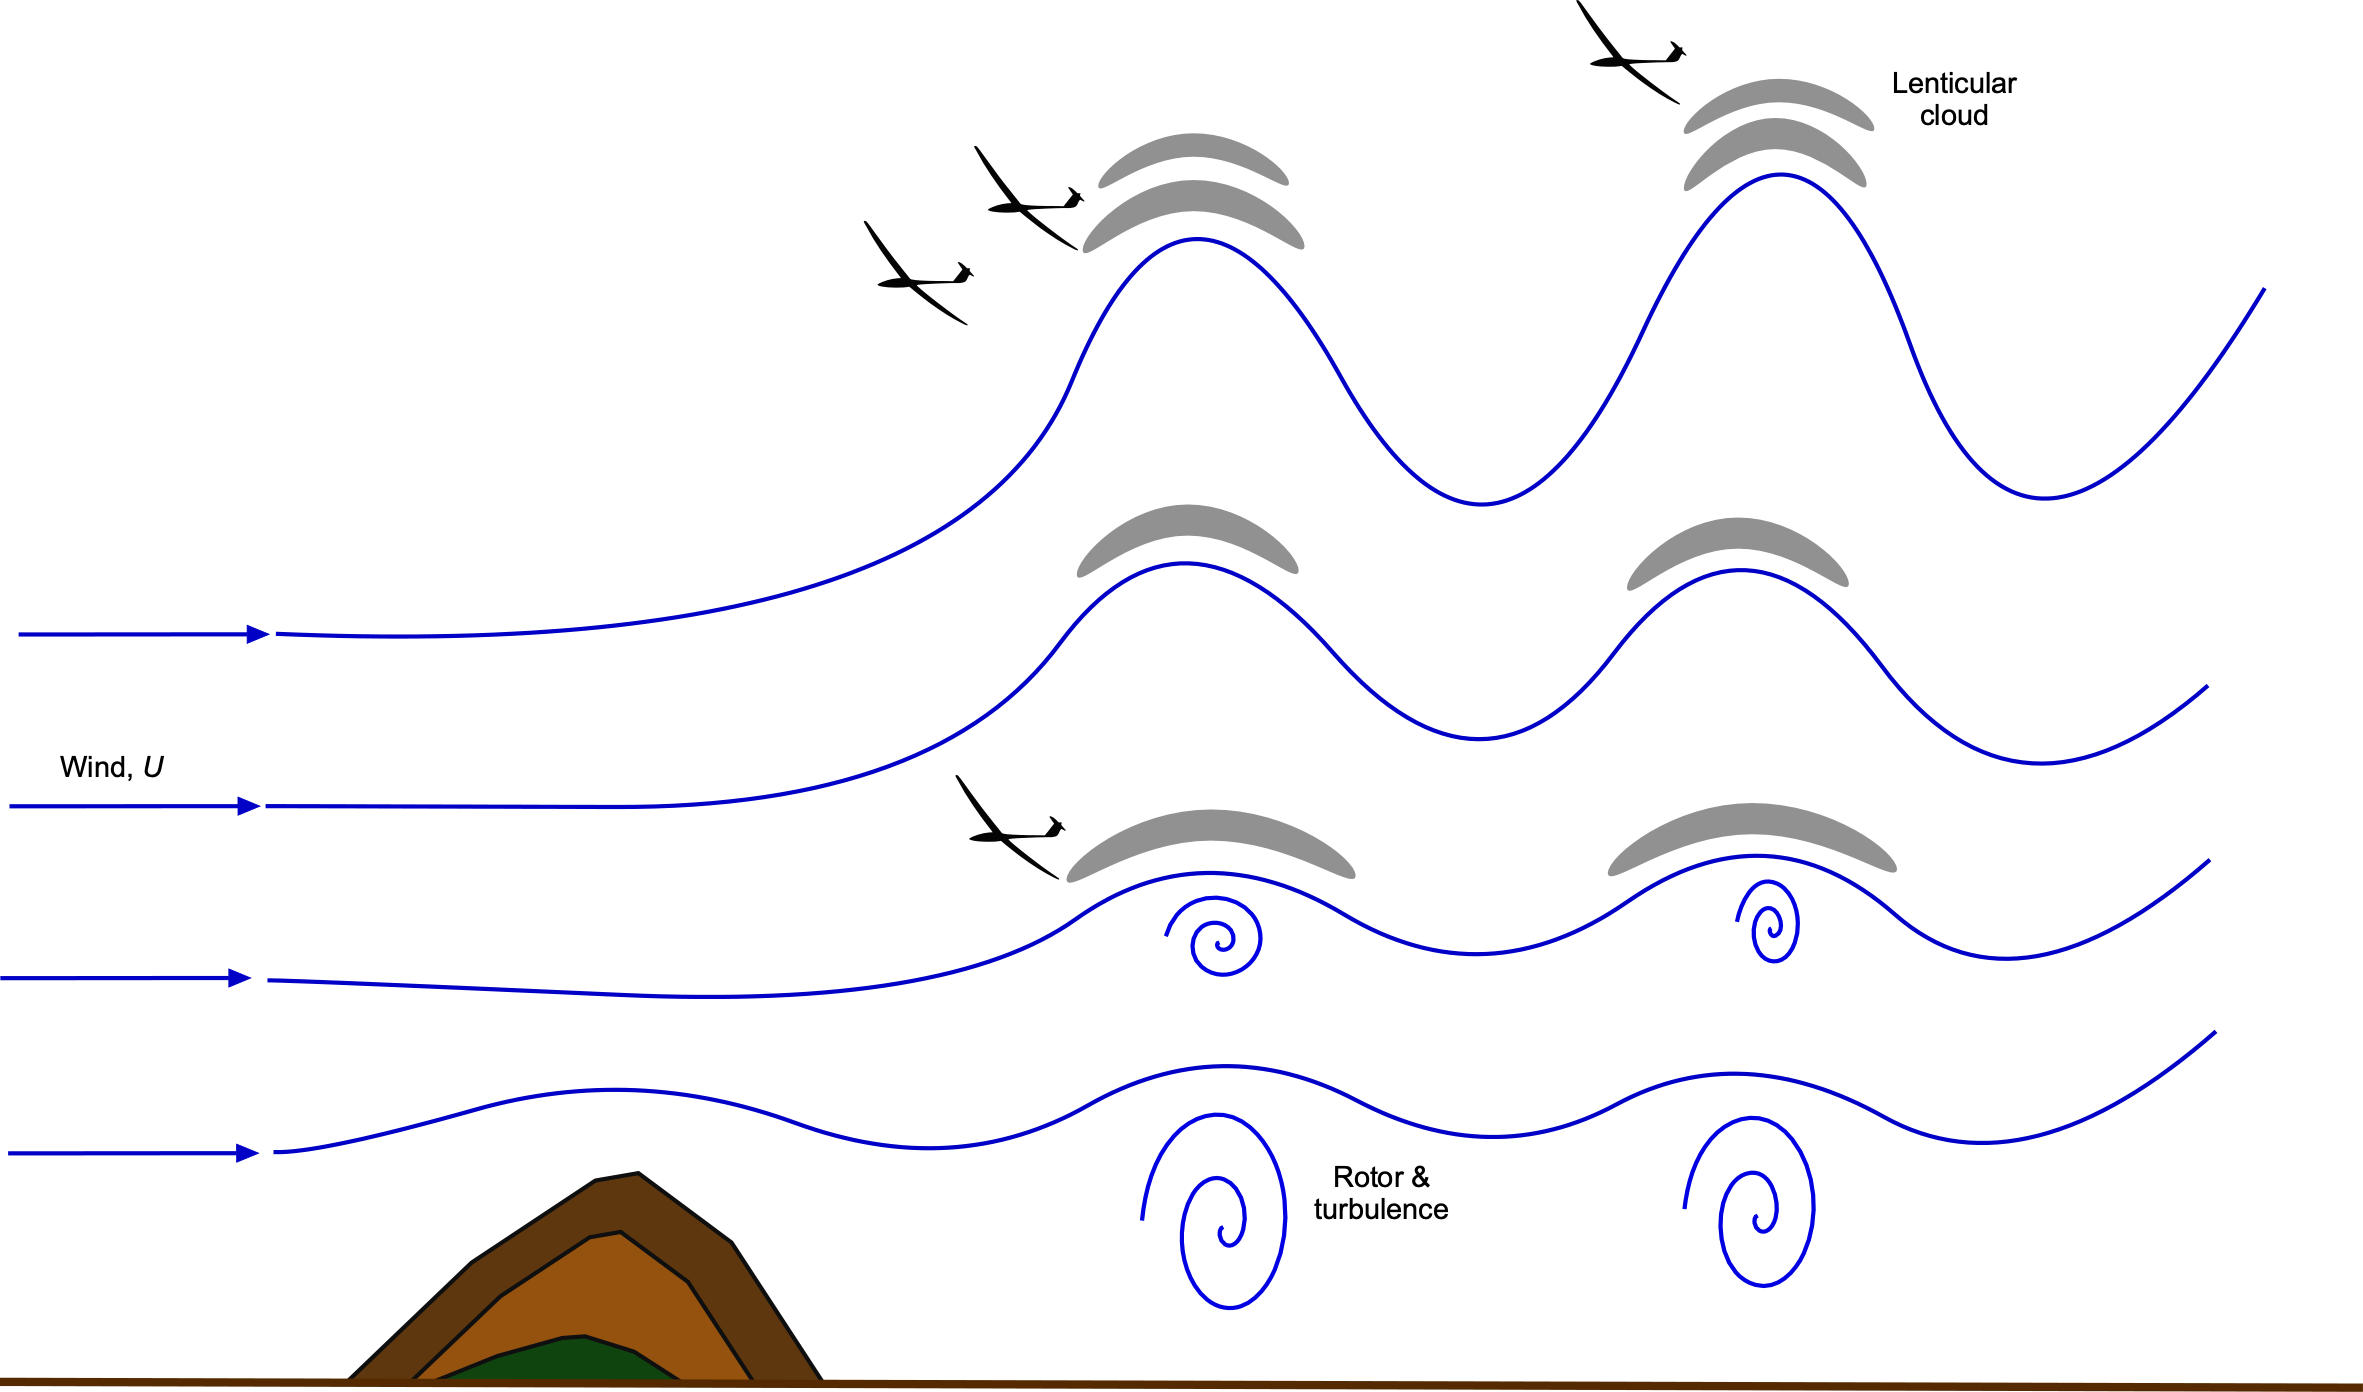
Assume a mean wind of speed over terrain in a stably stratified atmosphere. The linearized vertical wave equation (under the Boussinesq approximation) is
(66) 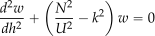
where  is the vertical velocity,
  is the horizontal wave number, and
  is the Brunt–Väisälä frequency, i.e.,
(67) 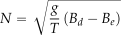
Here  is the dry adiabatic lapse rate,
  is the environmental lapse rate, which is the actual rate of decrease of temperature with altitude in the atmosphere at a given time and location, and
  is temperature. When
  , vertical oscillations in the atmosphere can develop.
Wave lift offers smoother, more laminar conditions than ridge or thermal lift and extends to much greater altitudes. The same energy balance applies, i.e.,
(68) 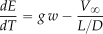
However, the origin of is different. In ridge soaring, vertical velocity results from terrain deflection and dissipative flow. In wave soaring, it originates from reversible oscillations in stratified air. The energy comes from the potential energy stored in vertical displacements of the atmosphere. As a result, wave lift can be much stronger and longer-lasting, and enables gliders to achieve record-setting altitudes to over 30,000 ft.
Dynamic Soaring
Dynamic soaring is a flight technique that enables a glider to extract energy from atmospheric wind gradients, particularly vertical shear in horizontal wind velocity. Unlike traditional soaring, which relies on thermals or rising air, dynamic soaring exploits differences in wind speed with altitude to sustain or increase energy without propulsion. This mechanism is famously used by seabirds such as the albatross, which can travel vast distances over the ocean with minimal flapping by repeatedly crossing the wind shear in the atmospheric boundary layer near the sea surface. Lord Rayleigh first described dynamic soaring in 1883 in the British journal Nature.
The principle behind dynamic soaring for a glider or sailplane is that it can gain or retain kinetic energy when it transitions between layers of air moving at different horizontal velocities. A typical maneuver involves climbing into a faster-moving airmass, turning while in that layer, then descending into a slower-moving layer while maintaining high airspeed, as shown in the figure below. Such effects can be found close to the ground or in the lee of hills and mountains. Because the wind velocity is different at each level, the glider’s airspeed relative to the surrounding air increases or decreases depending on the direction of the transition. When coordinated correctly, the glider emerges from the cycle with just as much or more energy than it started, so it can sustain flight or even climb to a higher altitude.
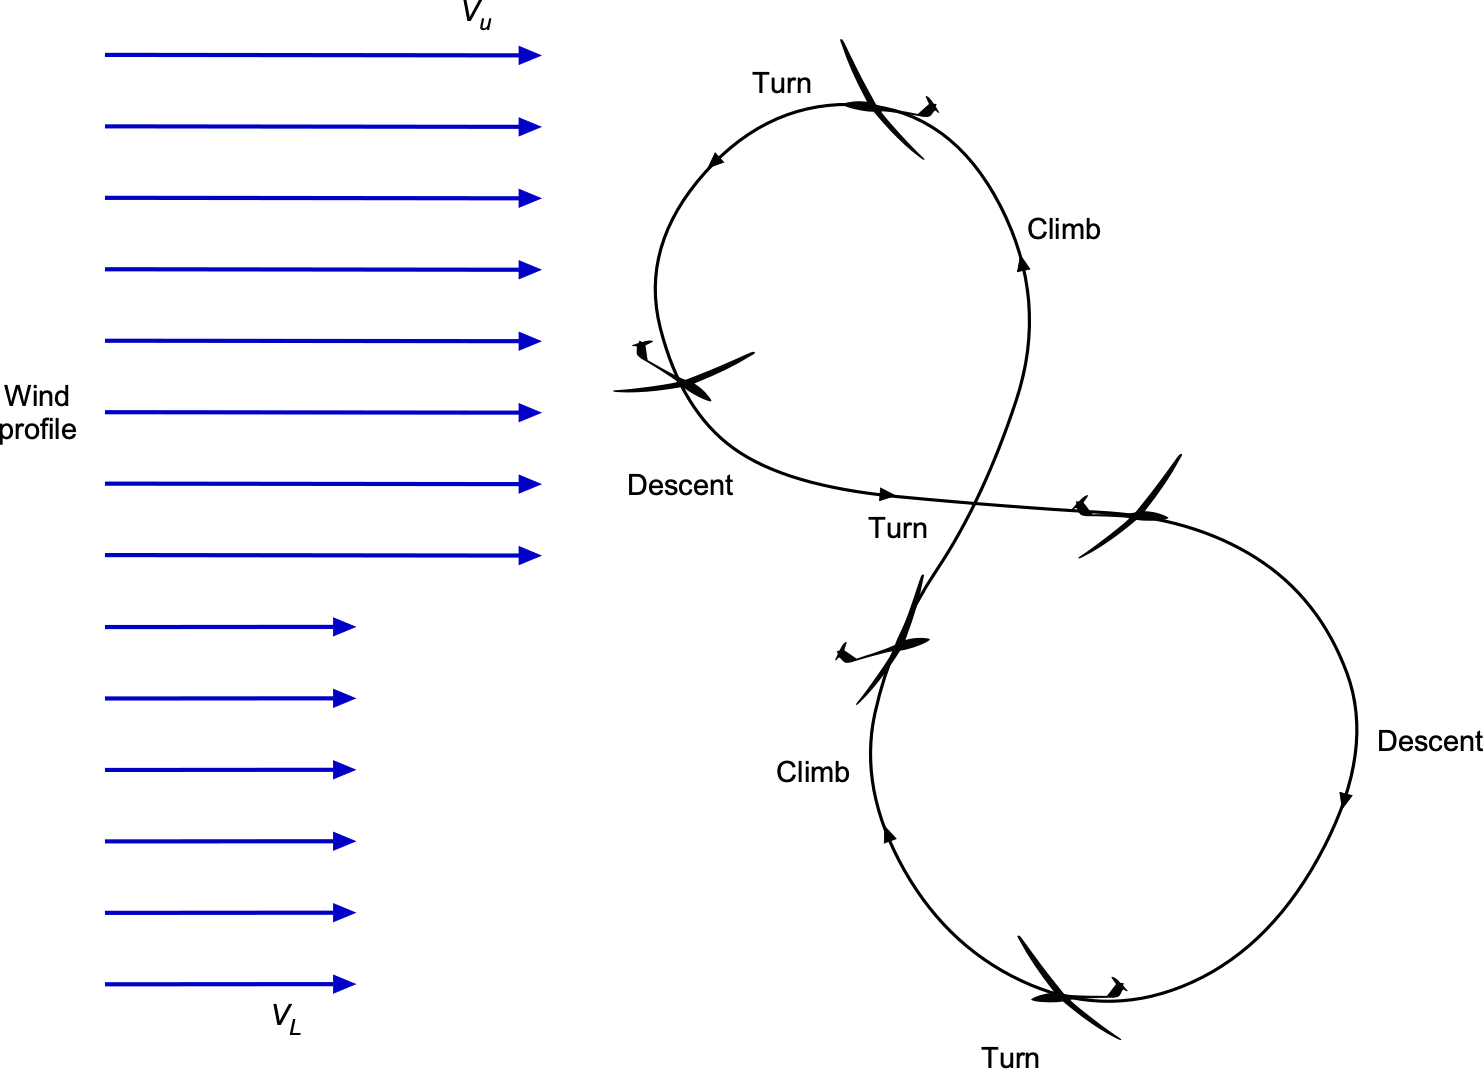
Assuming a wind field that varies only with altitude,
(69) 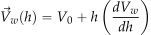
or in idealized models, a step change in wind velocity between two layers. When a glider climbs into a faster-moving airmass, its airspeed relative to the wind increases; upon descending, it retains kinetic energy in the inertial frame.
The glider’s mechanical energy is
(70) 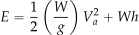
where  is the airspeed relative to the airmass. A change in airspeed due to wind shear yields
(71) 
If this energy gain exceeds drag losses, the maneuver is energetically favorable. Efficient dynamic soaring requires precise control of flight path, bank angle, and timing.
An efficient dynamic soaring maneuver requires careful coordination of turn angles, climb and descent rates, and bank angles to ensure the glider gains more energy from wind shear than it loses to drag. The minimum required wind shear for sustainable soaring depends on the weight of the glider, its aerodynamic characteristics, and the geometry of the flight path. Not all pilots will have the flying skills needed to use the principles of dynamic soaring.
Seabirds such as the albatross execute dynamic soaring maneuvers naturally, flying close to the ocean surface where wind gradients are steep because of the surface boundary layer. Observational data shows that their flight paths involve cyclic transitions between layers, forming smooth arcs that match theoretical predictions for optimal energy gain. Inspired by these natural strategies, engineers are developing autonomous UAV systems that use dynamic soaring to extend range and endurance. These systems rely on real-time sensing of wind fields and adaptive trajectory planning to extract atmospheric energy efficiently and without propulsion.
So You Want to be A Glider Pilot?
Becoming a glider pilot can be a thrilling and rewarding experience, and the best way to learn how to fly. If you can learn to fly a glider or a sailplane, then learning to fly another aircraft is easier. Engineers make good pilots because they have a technical understanding of the principles and techniques involved. Glider clubs often provide affordable training opportunities and will have experienced instructors who can offer ground school courses on aerodynamics, meteorology, navigation, regulations, and flight planning.
The flight training will progress through different stages, starting with basic maneuvers such as turns and progressing to more advanced skills such as the steep turns used using thermalling, as well as stalls and spins. As you gain experience and proficiency, your instructor will determine when you’re ready for your first solo flight. After completing several solo flights and meeting other essential requirements, you’ll undergo a check flight with a flight examiner other than your instructor. The check-flight typically includes oral questions and a comprehensive flight evaluation to assess your knowledge and skills. Subsequent learning and improvement in flying sailplanes is a continuous process, gaining experience by flying in different locations or with other types of increasingly higher-performance sailplanes.
Summary & Closure
Gliders and sailplanes represent the epitome of human ingenuity in achieving unpowered flight. These remarkable aircraft rely solely on the forces of nature and skillful piloting to soar through the skies. By harnessing rising air currents and exploiting aerodynamic principles, gliders and sailplanes offer a unique and exhilarating flying experience. Gliding and soaring offer an environmentally friendly way to experience flight other than the initial launch into the sky.
The development of gliders and sailplanes has contributed significantly to the aviation field. Their growth and technological advancements have influenced other aviation sectors, including commercial and military aircraft. Research conducted on glider aerodynamics and performance has held to advancements in aircraft design, efficiency, and safety. Gliders and sailplanes are designed to have high aspect ratio wings, smooth aerodynamic surfaces, and lightweight structures, allowing them to achieve remarkable glide ratios over 50:1. Pilots participate in various competitions, ranging from local club events to international championships, where they showcase their skill and expertise in exploiting the available thermal updrafts, ridge lift, and wave phenomena to achieve impressive distances and altitudes.
5-Question Self-Assessment Quickquiz
For Further Thought or Discussion
- Use the internet to explore the origins of sporting gliders and sailplanes and how they have evolved over the last half-century. Discuss significant milestones, influential designers, and technological advancements that have shaped the development of these aircraft.
- What are some essential principles of aerodynamics specific to gliders and sailplanes? Discuss concepts such as lift, drag, glide ratio, and the various factors that influence the performance and efficiency of these aircraft.
- Explore the design considerations and engineering behind gliders and sailplanes. Discuss different wing configurations, materials used, structural integrity, and the balance between weight and strength in building these aircraft.
- Examine the flying techniques employed by glider and sailplane pilots. Discuss topics like using thermal updrafts for altitude gain, ridge soaring, wave soaring, and the overall art (and science!) of finding and utilizing the atmospheric lift.
- Discuss the challenges and strategies of long-distance cross-country flights with gliders and sailplanes. Explore route planning, weather analysis, navigation techniques, advanced instrumentation, and technology.
- Do some online research and explore the world of competitive gliding and sailplane racing. Discuss different competition formats, strategies used by pilots, scoring systems, and notable gliding competitions and championships held worldwide.
- Discuss the importance of safety in gliding and sailplane operations. Explore the training requirements, certification processes, safety protocols, and best practices for pilots and flight instructors in these aircraft.
- Speculate on the future of gliding and sailplane technology. Discuss potential advancements in materials, design, and other factors. Is it possible to build a sailplane with a lift-to-drag ratio of 100?
Other Useful Online Resources
For additional resources on gliders and sailplanes, follow up on some of these online resources:
- International Scientific and Technical Soaring Organisation. Find it here.The objectives of the OSTIV are to encourage and coordinate internationally the science and technology of soaring.
- Technical Soaring – An International Journal. Access it here. Papers from the archive are freely available for download.
- Soaring Society of America (SSA). The official website of the SSA, the governing body for gliding in the United States. It offers information on glider operations, competitions, safety, and more. Website.
- British Gliding Association (BGA). The BGA is the governing body for gliding in the United Kingdom. Their website provides resources on glider clubs, training, events, and safety guidelines. Website.
- International Gliding Commission (IGC). The IGC oversees international gliding records and competitions. Their website offers information on rules, records, championships, and world gliding news. Website.
- Gliderpilot.net. A comprehensive online resource for glider pilots. It includes articles, technical information, flight planning tools, forums, and a directory of glider clubs worldwide. Website.
- Gliding International. An online magazine dedicated to gliding and sailplanes. It covers various topics, including technology, competitions, training, and personal stories. Website.
- Gliding Australia. The official website of Gliding Australia provides information on gliding clubs, events, news, and resources for glider pilots in Australia. Website.
- Segelflug.de. A German website offering a variety of resources for glider pilots, including news, articles, flight planning tools, and a directory of glider clubs. Website.
- Glider Flying Handbook. Published by the Federal Aviation Administration (FAA), this handbook provides comprehensive information on glider operations, flight maneuvers, weather, regulations, and safety. Website.
- GlidingNZ. The official website of Gliding New Zealand offers information on gliding clubs, competitions, training, and resources for glider pilots in New Zealand. Website.
- Gliding Australia. The Gliding Australia website provides information on gliding clubs, events, safety guidelines, and resources for glider pilots in Australia. Website.
- Sailplane Directory. Sailplane Directory is an online database that lists various sailplane models. It provides information on specifications, performance characteristics, and historical details of different sailplanes. Website.
- Gliderpilot Network. Gliderpilot Network is an online community and resource hub for glider pilots. It offers a forum for discussions, flight logbook capabilities, a glider pilot directory, and various resources related to gliding. Website.
- YouTube Channels. Several YouTube channels focus on gliding and sailplanes, providing educational videos, flight demonstrations, and insights into the gliding world. Some popular channels include “GliderPilotNet” and “THERMAL.”
- Gliding and Sailplane Forums. Online discussion forums dedicated to gliding and sailplanes provide a platform for pilots and enthusiasts to exchange knowledge, ask questions, and share experiences. Some popular forums include “Gliding Forum” and “Sailplane Talk.”
- A "yaw string" is just a piece of yarn or string attached to the canopy with tape, which is a simple but effective way of determining the sideslip angle. Keeping the yaw string aligned with the nose of the sailplane ensures the lowest drag. ↵