42 Performance Envelopes
Introduction
All aircraft have operational limits regarding the maximum and minimum airspeeds and altitudes at which they can fly in steady, level, unaccelerated flight, e.g., within the airspeed versus altitude boundary, as shown in the figure below. Notice that, by design, some aircraft, such as military supersonic-capable fighter jets, can fly faster and higher over a broader range of flight conditions than other types of airplanes. However, remember that military aircraft also have different types of missions. In comparison, commercial jet airplanes are very much point designs. They are designed for cruising for long periods at high altitudes at a specific airspeed (or Mach number). Turboprops are often used for short-haul flights. While they fly at lower altitudes and airspeeds, they are better suited for operating out of shorter runways and have greater climb rates at lower airspeeds than jets. They are also better for operating out of airports situated in mountainous terrain.
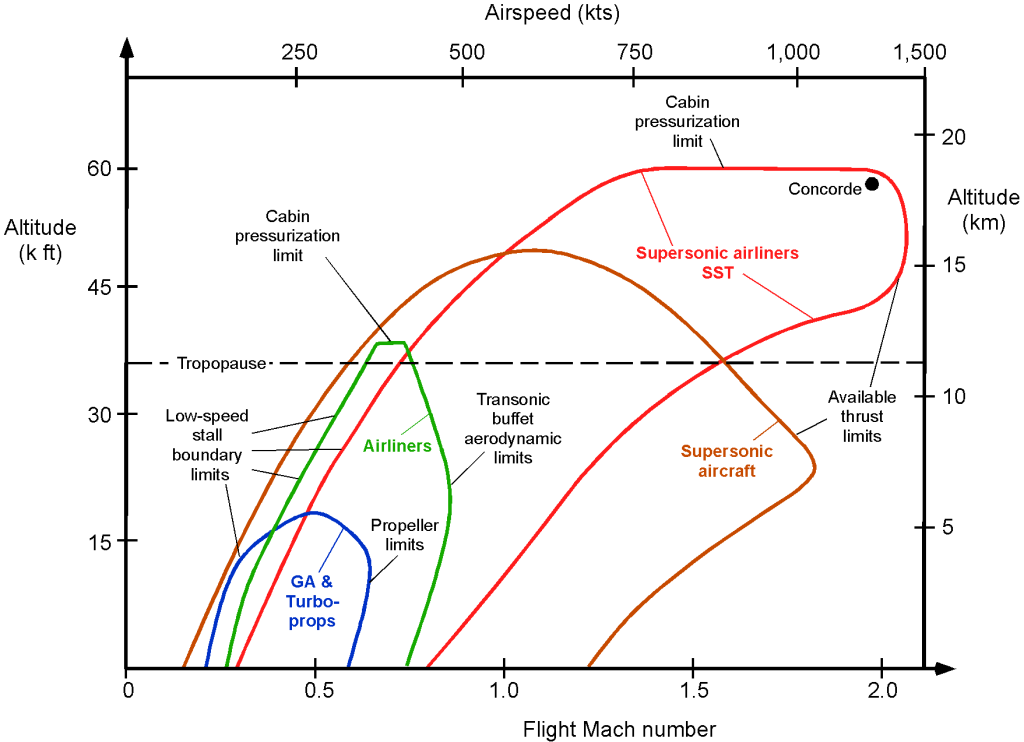
The area inside the boundaries that limit the normal flight operations of an aircraft is called the operational flight envelope. The flight corridor is often called the speed range or band over which the airplane can fly at any given altitude and weight without encountering any flight limits. The limits of the envelope are defined and set based on several criteria, such as:
- The highest achievable Mach number.
- The engine power available, e.g., for a turboprop or piston engine.
- The thrust available, e.g., for a turbojet or turbofan.
- The onset of maximum structural loads.
- The onset of aeroelastic effects such as flutter or buffeting.
- Limits could also be set by excessive aerodynamic heating for supersonic aircraft.
Learning Objectives
- Understand the meaning of an airplane’s flight envelope and a flight corridor.
- Know about the various factors that may limit the operational flight envelope of an airplane, including the onset of stall.
- Understand the phenomenon of wave drag and why it can also limit the flight envelope.
- Be aware of the ideas of reducing drag from compressibility effects using supercritical wing design and the area rule.
Flight Envelopes
The size and shape of the flight envelope (or flight corridor) will depend on the type of airplane, i.e., whether it is propeller-driven or jet-powered, has an unpressurized or pressurized fuselage, and whether it is designed explicitly for subsonic, transonic, or supersonic flight. Naturally, the exact size and shape of the envelope for any given airplane also depends on the atmosphere’s properties, particularly the air’s density and temperature. Generally, the lowest possible airspeed of an airplane (either jet-powered or propeller-driven) is dictated by the onset of wing stall, which determines the left-side boundary of the flight envelope. This stalling airspeed will be a function of the airplane’s weight and altitude, as well as the wing flap settings and whether the undercarriage is up or down.
The right side of the boundary will be set by the highest possible airspeed, which is usually limited by the power available (for propeller-driven airplanes) or thrust available (for jet engines) to overcome the drag, which is a function of the airplane’s shape and flight Mach number. The right-side boundary may also be limited by the onset of transonic buffeting effects, control system “buzz,” or the onset of wing flutter.
The upper edge of the flight envelope is the maximum attainable altitude, referred to as the operational ceiling. The ceiling is the altitude above which an aircraft cannot climb, which is usually defined based on a threshold of a diminishing rate of climb of less than 100 ft/min. The attainable flight ceiling depends on the excess power available relative to the aircraft’s aerodynamics and other characteristics, including weight. In some cases, however, such as on most commercial airplanes, the flight ceiling is limited by the onset of wave drag or transonic buffet or by the airplane reaching some maximum structural loads associated with the pressurization of the fuselage (which is a trade with airframe weight), even though the airplane may have the excess power available to achieve higher flight altitudes.
Trimmed Flight
In a steady, level, unaccelerated flight, the airplane’s three forces (lift, drag, and side force) and the three corresponding moments (pitching, rolling, and yawing) are perfectly balanced. In this case, the airplane is said to be in trim, as shown in the figure below. The balance of forces in steady trim is that vertical equilibrium requires that lift  = weight
  and horizontal equilibrium requires that thrust
  = drag
  , i.e.,
(1) 
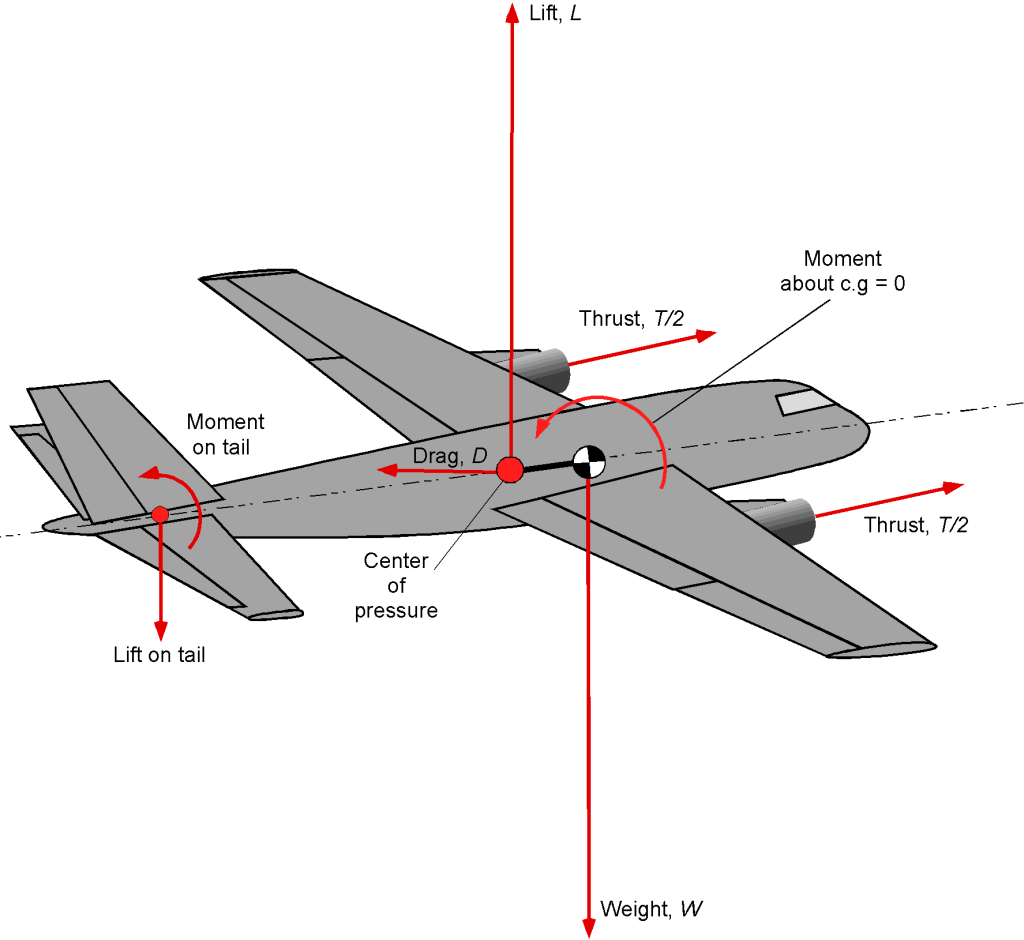
In this case, another assumption is that the thrust vector’s line of action is (primarily) in the flight direction. But, of course, full flight trim also requires that the airplane have a moment balance in pitch, roll, and yaw about its center of gravity. Therefore, the side force is also assumed to be zero in trimmed flight.
Remember that the wings generate the lift to overcome the weight, and the engines provide the propulsive force to overcome the drag of the airplane, generating this thrust requiring a source of power and fuel. In terms of basic aerodynamics, for vertical equilibrium, then
(2) 
where  is the air density in which the airplane is flying,
  is the reference wing area, and
  is the total wing lift coefficient (the assumption here is that the wings generate all lift). Notice that
  where
where  comes from the ISA model, i.e.,
(3) 
Rearranging this equation allows us to solve for the lift coefficient that needs to be produced on the wing for a given flight speed, i.e.,
(4) 
or the flight speed that corresponds to a given lift coefficient, i.e.,
(5) 
Recall that the ratio of an airplane’s weight to its lifting wing area,  , is called wing loading. Notice that the lift coefficient is proportional to weight (or to wing loading) but decreases with the square of the airspeed. The lift coefficient also increases with altitude for a given true airspeed and weight.
Stalling Airspeeds
 , and it depends on the nature of the wing used on the airplane, including its planform, twist, and airfoil section. The actual value of also depends on whether the flaps and other high-lift devices, such as slats, are retracted or deployed, as shown in the figure below. Notice that flaps are very effective in increasing , but the use of a slat can boost the by a further 50%.
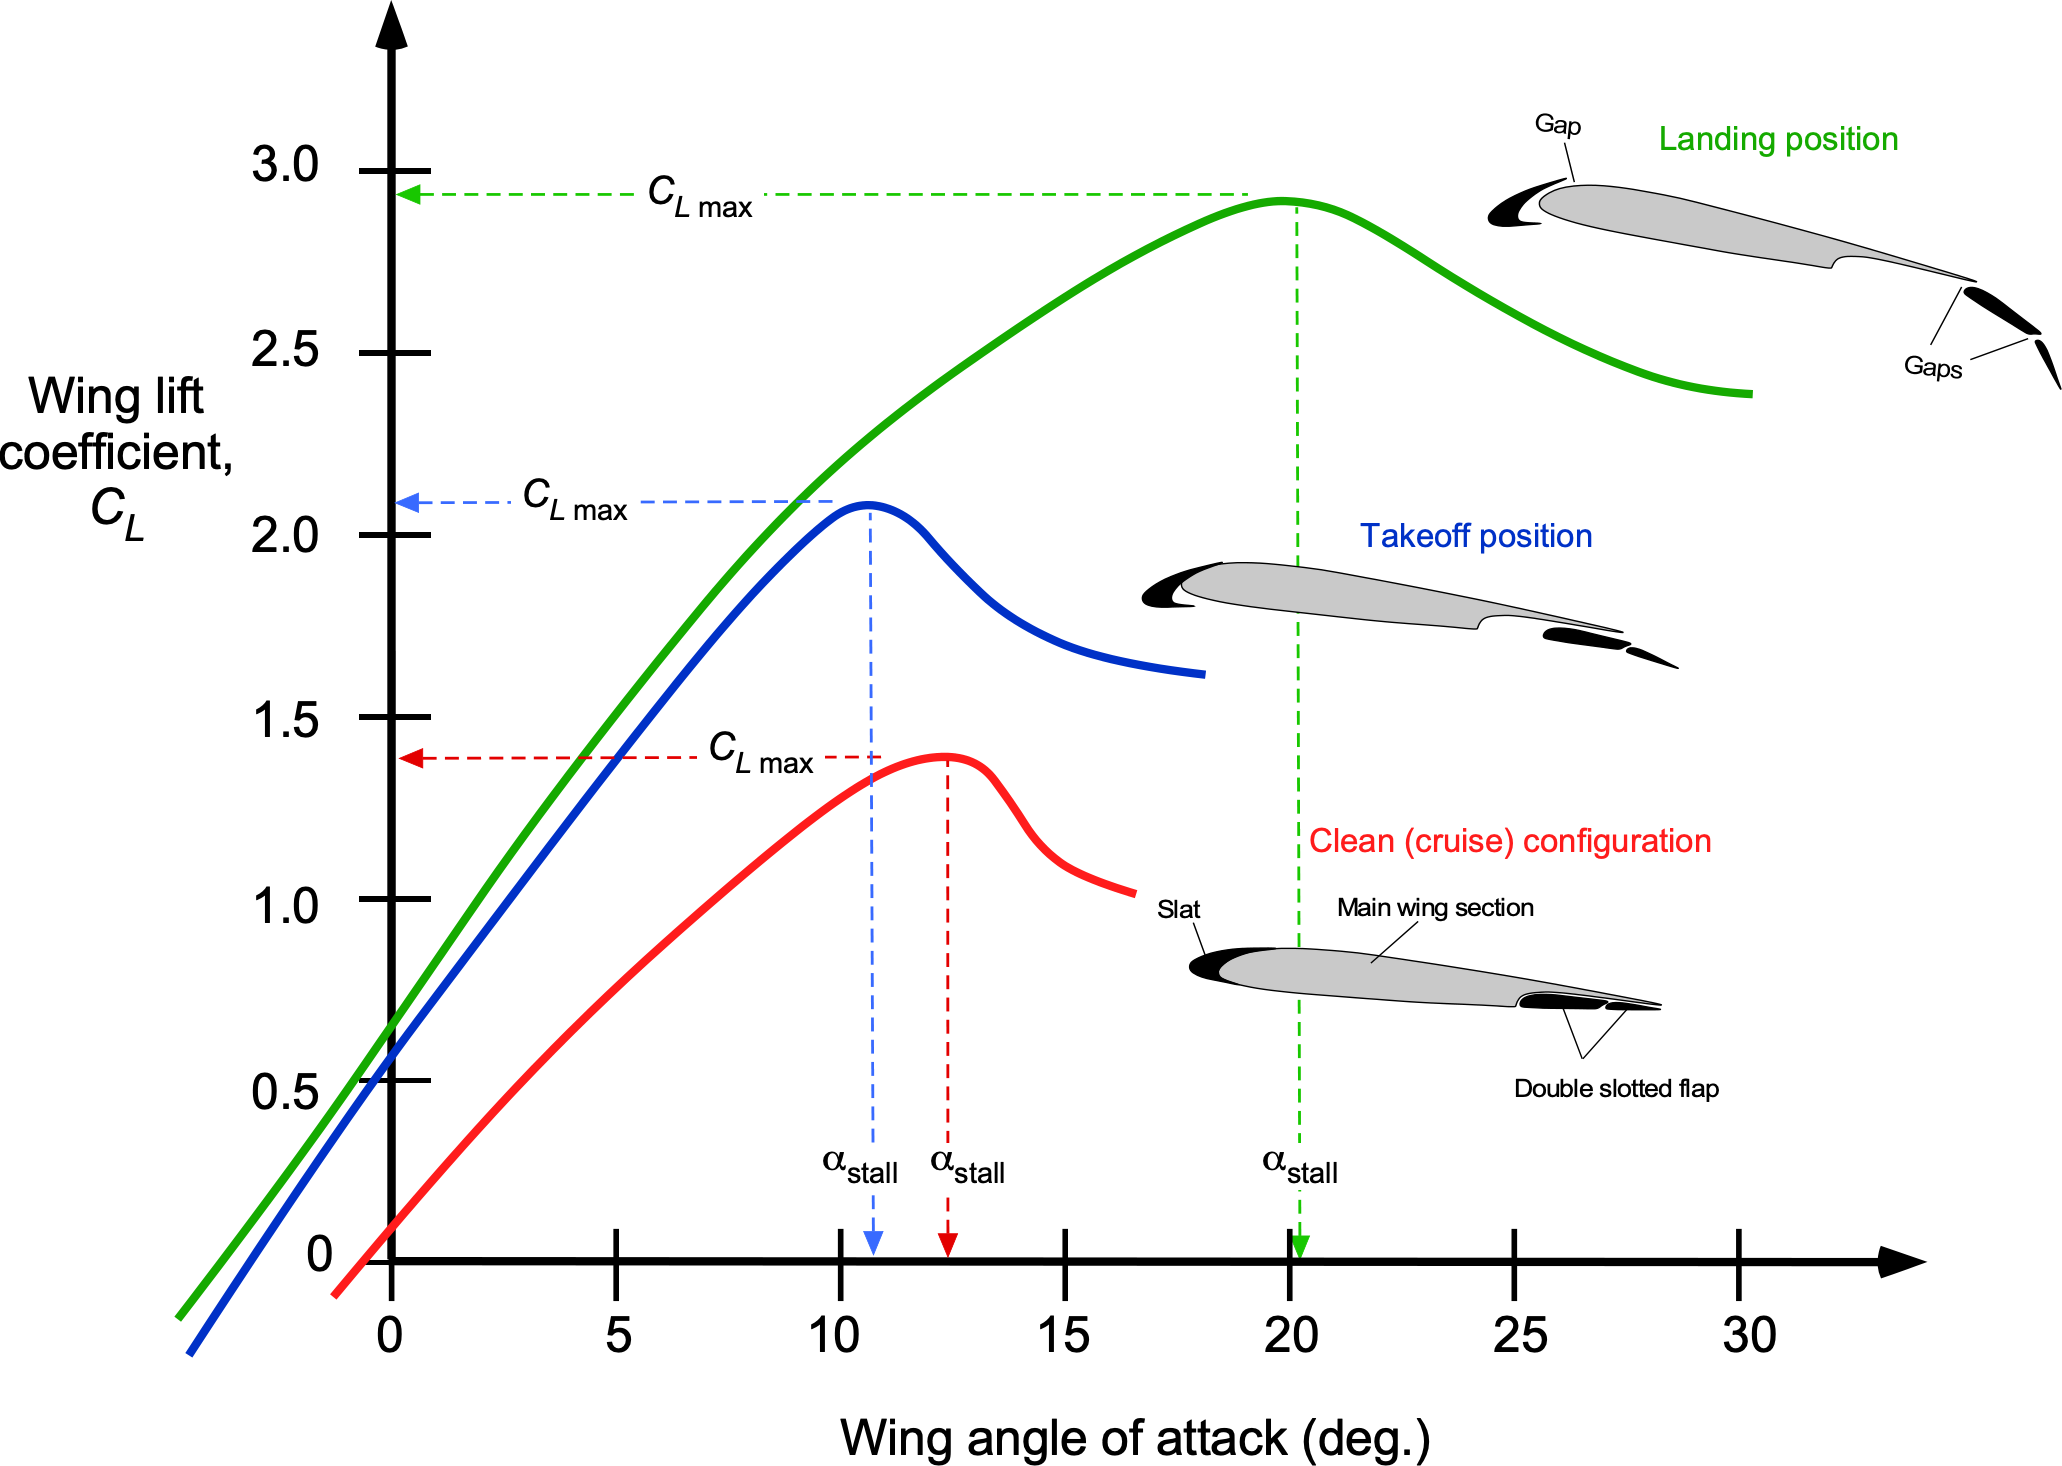
Although the value of may not be precisely known by calculation, it can be determined indirectly from flight tests with the airplane from measurements of true airspeed and density altitude. After determining the for the wing, the stall speed in steady-level flight can be solved at any weight and density altitude. i.e.,
(6) 
using the value of from the ISA model, i.e., based on the prevailing pressure altitude and outside air temperature. Notice that for a given , the stalling speed depends on the wing loading, , i.e., all things being equal, an airplane with a higher wing loading will stall at a higher airspeed.
If a linear lift-curve slope of the wing is assumed, say  , then the angle of attack of the wing
  (measured relative to the zero-lift angle) can be calculated using
(7) 
and so the stall angle of attack  will be
(8) 
the value of typically being less than 15 at low Mach numbers and lower than that at higher Mach numbers, e.g., may be as low as 5 at a Mach number of 0.7. However, it is important to appreciate that a wing will stall at any airspeed if the angle of attack is high enough. For this reason, caution must be used when referring to stall speeds.
In summary, four conclusions can be drawn from the use of Eq. 6, all of which apply to level, unaccelerated flight:
- Stall speed,
 , will increase with the increasing weight of the airplane.
 - will increase with increasing density altitude, i.e., with a lowering of the air density.
- will decrease with increasing values of wing , which, as previously discussed, can be achieved by the application of wing flaps and/or leading-edge slats.
- will decrease with increasing wing area. Increased lifting wing area is also possible with certain types of flaps, such as Fowler flaps.
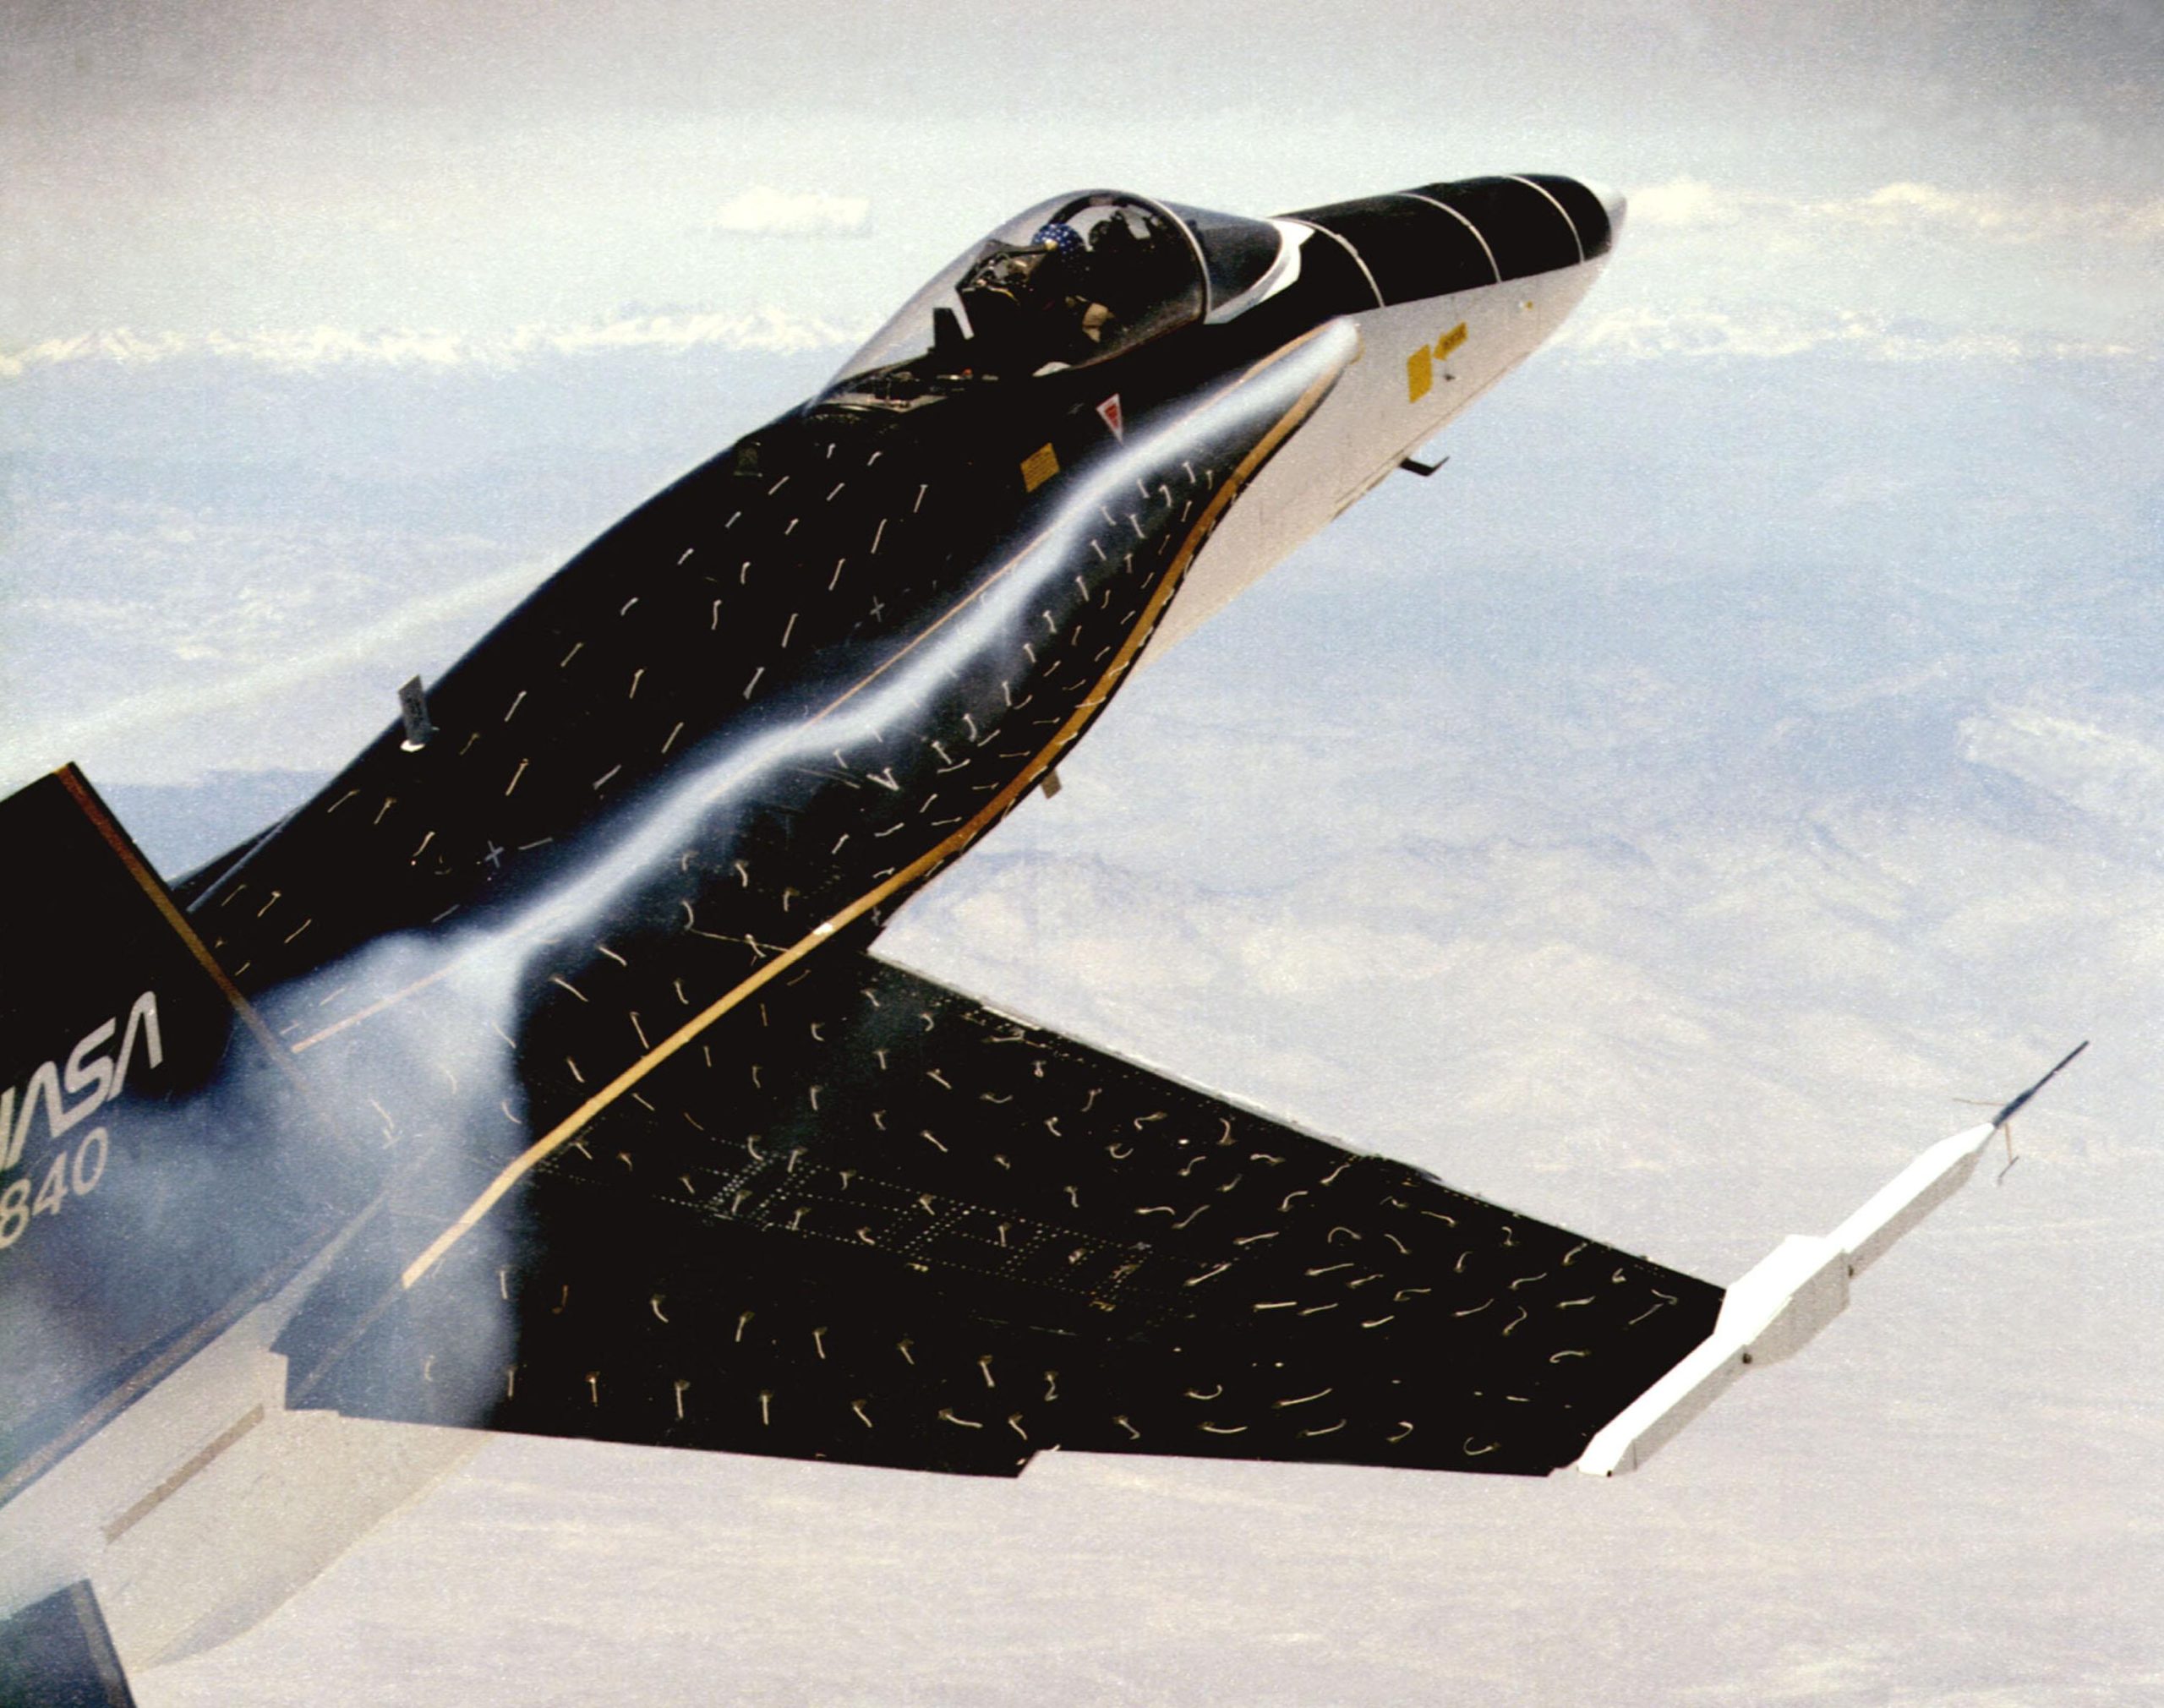
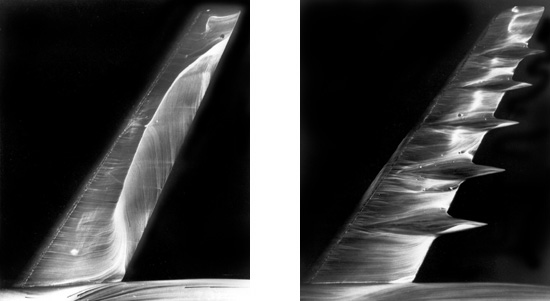
Stall airspeeds, and so the identification of the boundary on the left side of the flight envelope, is carefully measured during flight testing. Besides measurements of stalling airspeeds, the actual stall developments on aircraft wings can be studied by placing strips of yarn called “tufts” all over the wing’s upper surface, an example being shown in the photograph below. The tufts are arranged in orderly rows, spanwise and chordwise, over the wing surface. The tufts are free to move around in the airflow. When the tufts are blown straight back, the flow is fully attached. However, suppose the tufts change direction and lift from the surface. In that case, the flow at those locations is inevitably separated, and this condition is likely an indicator of an incipient stall on the wing.
The stall patterns that develop on any given wing depend on many factors. It is desirable that the stall starts at the wing’s root and works forward and outward. The consequence of this behavior is buffeting, so the pilot will recognize the stall onset before the stall progresses too far. It is expected that the airplane also tends to pitch down naturally at the stall, reducing the wing’s angle of attack and suppressing further stall developments. It is also essential that the wing’s outer parts have a fully attached flow so there will be no tendency for the aircraft to roll and that the ailerons will be fully effective in their usual operational sense. Some aircraft have been discovered to experience control reversals and spin tendencies during stall testing, a dangerous behavior that can disqualify it from being awarded a certificate of airworthiness.
Limiting (Maximum) Cruise Speeds
The figure below shows a historical trend of how cruise airspeeds for commercial transport airplanes have increased over the decades, which is a direct consequence of aeronautical technology’s rapid advancements and maturation. Of course, the introduction of the jet engine was responsible for the more rapid growth in the achievable cruise speeds obtained after 1960, first with the turbojet and later with turbofans.
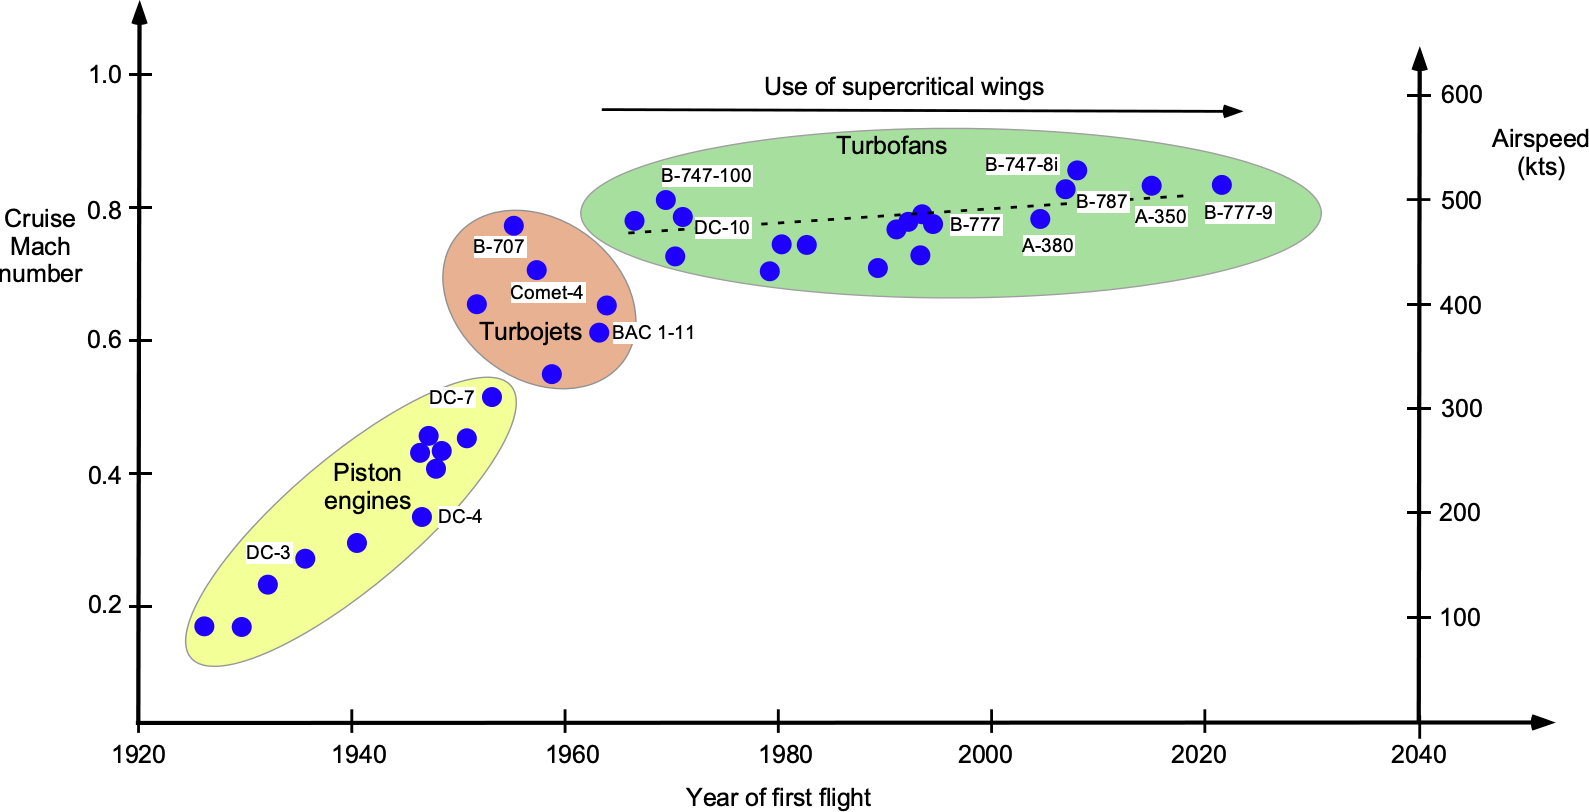
However, it can also be seen that since the early 1970s, the cruise airspeeds for commercial airplanes have plateaued, with corresponding achievable cruise flight Mach numbers in the range of 0.8 to 0.85. There are a couple of exceptions to this trend with the Anglo-French Concorde and the Russian Tu-144, but these airplanes were explicitly designed to be at supersonic Mach numbers. While supercritical wing designs have extended the flight envelope of airliners to higher transonic Mach numbers of about 0.85, the eventual onset of wave drag and shock-induced buffeting remains a physics-based barrier to faster flight.
Supercritical Flows & Drag Rise
One reason that cruise speeds for commercial airliners have reached a plateau is because of the buildup of high drag on a wing as transonic flow conditions are approached. The fundamental physics of what happens on the wing section is shown in the figure below. The drag buildup from the development of compressibility and shock waves takes much more thrust to overcome, and there are other issues about operating at higher flight Mach numbers, such as the onset of shock-induced flow separation and buffeting, as has already been discussed.
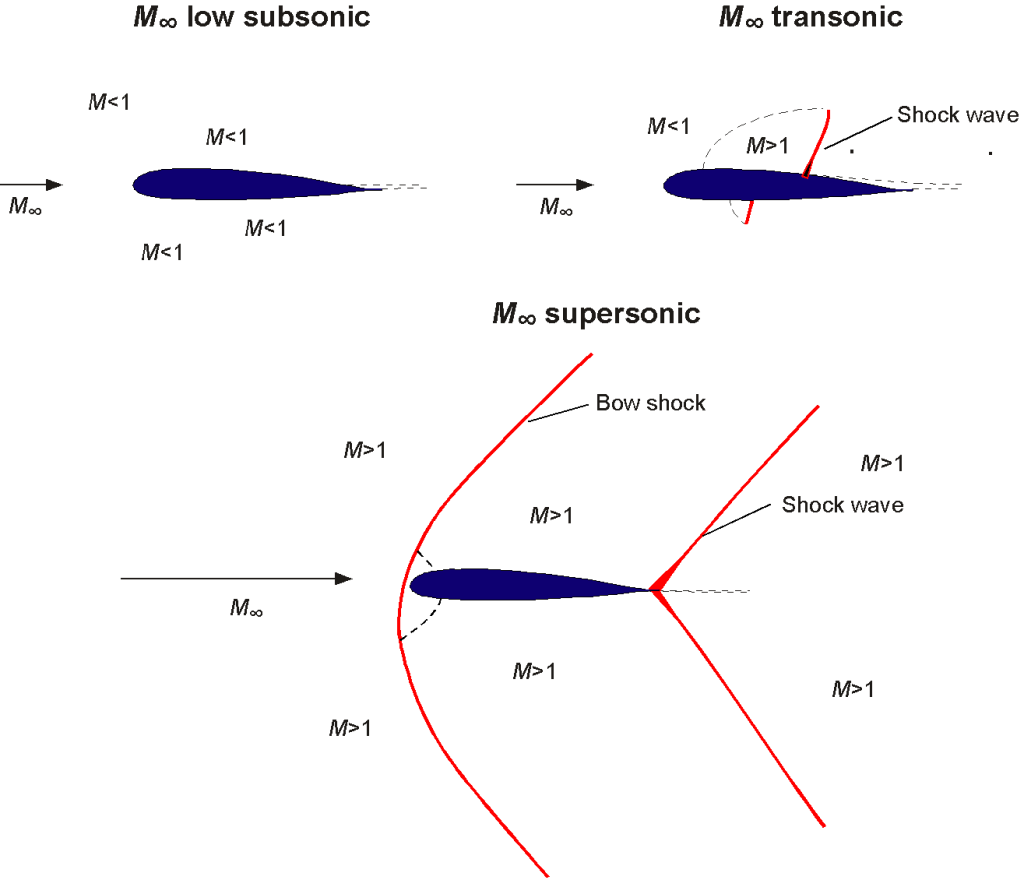
At some flight (free-stream) Mach number, the local flow at a point on the wing’s surface reaches sonic conditions, called the critical Mach number. As the free-stream Mach number increases further, a small pocket of supersonic flow develops on the wing section, resulting in a weak shock wave in the flow. As the Mach number further increases, the shock strengthens and moves aft over the wing section, forming a supersonic region. An associated shock wave also develops on the lower surface, although this is much weaker. This condition is called the well-established transonic flow region, where the formation of shock waves results in an energy loss that manifests as a form of drag called wave drag. Wave drag causes the total drag on the wing to increase rapidly when approaching a Mach number of one, as shown in the figure below.
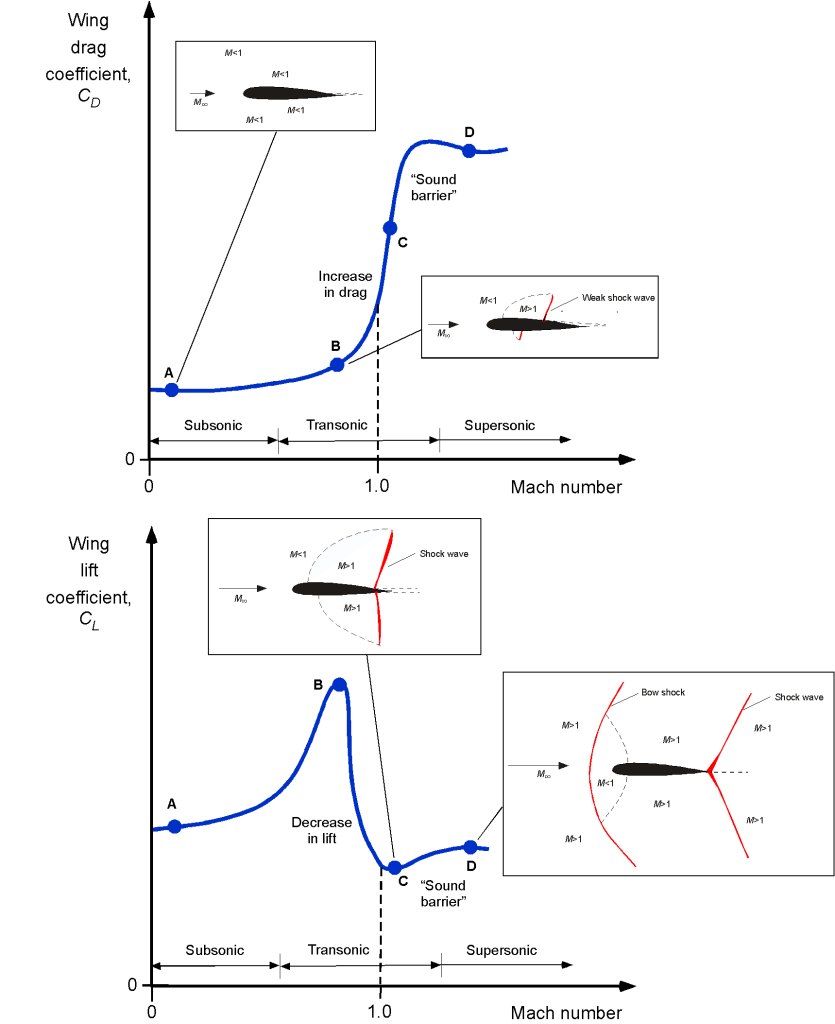
Because steep adverse pressure gradients also accompany the shock waves that develop during transonic conditions on the wing section, the boundary layer downstream of the shock wave becomes thicker, and the profile drag increases. If the shock wave becomes sufficiently strong (intense), flow separation may occur at the foot of the shock, leading to a buffeting aerodynamic phenomenon. Buffeting can result in high levels of vibration transmitted to the airframe, especially the tail structure, and it is not a sustained flight condition. The onset of buffeting can also cause aeroelastic concerns, so the possibility of this behavior must be scrutinized through flight testing. The onset of buffeting is usually a limiting factor in the operational flight envelope of most aircraft (unless they are designed for supersonic flight) and is referred to as the buffet boundary.
If and when the Mach number approaches unity, the shock waves move to the trailing edge of the wing section. Finally, when the Mach number exceeds one, a bow wave appears just ahead of the wing section, and the shock waves at the trailing edge become oblique. For supersonic airplanes, these strong shocks are responsible for the pressure changes heard on the ground, manifesting as the impulsive “boom-boom” sound, known as the sonic boom, as the airplane passes overhead at supersonic speeds. The drag rise on the aircraft during the transition from transonic to supersonic flight usually requires excess thrust to be produced using an afterburner. Some aircraft may be subsequently able to cruise supersonically without the use of the afterburner, but it depends on the engine. Concorde, for example, could cruise supersonically without the afterburners because it used a unique variable geometry inlet design to increase the pressure into the engine.
Reducing Compressibility Drag
The minimization of wave drag on the wings as the transonic flight regime is approached is crucial to lowering drag and/or allowing the airplane to fly faster and opening up the flight envelope before significant drag rise is encountered. In addition, lower drag means lower thrust and power are required for flight, so less fuel is expended, and more flight range can be achieved.
Swept Wings
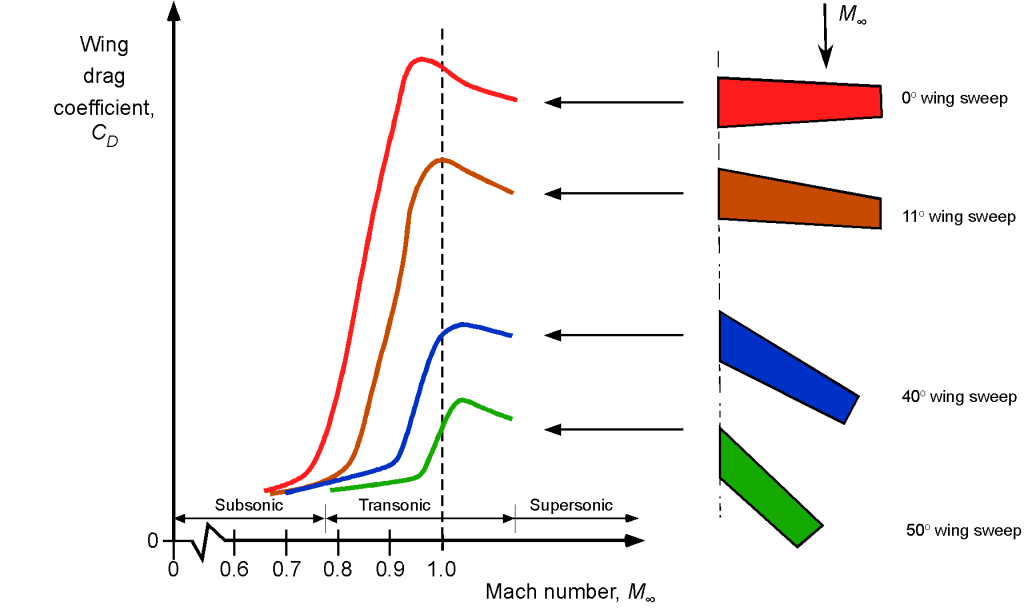
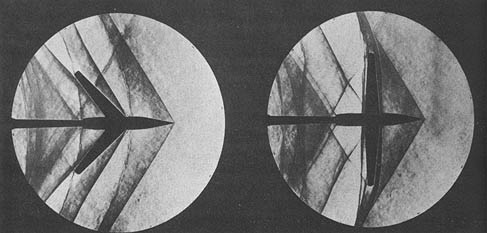
The figure below shows that wing sweep profoundly affects transonic and supersonic drag. This characteristic is because the use of swept-back wings reduces the strength of the shock waves and prevents the shocks from interfering with the flow over the wings, causing flow separation and drag. However, although swept wings can help delay this drag rise from compressibility effects, other aerodynamic and aeroelastic problems are associated with swept wings, so aircraft designers tend to use as little wing sweep as possible, 20 to 30 degrees being typical of many airliners.
- Below is a visualization of the flow of swept and unswept wings at a low supersonic speed, obtained using the schlieren flow visualization method; the circular images from the spherical mirrors always indicate the use of schlieren. Notice that with sweepback, shockwaves do not interact directly with the wing, which keeps the drag low. However, with the unswept wings, the shock waves are stronger and interact strongly with the wing, causing a loss of lift and flow separation that drives up the drag.
Airfoil Sections
The figure below shows the difference in the shapes of a conventional airfoil and a supercritical airfoil. The basic principle in transonic airfoil design is controlling the flow’s expansion to supersonic speed and subsequent recompression. Compared to a conventional wing section, a supercritical wing section is distinctive in that it is much flatter (i.e., less cambered) along the top surface but with significantly more camber at its trailing edge. Variations of supercritical airfoil sections are used on all commercial jet airliners.
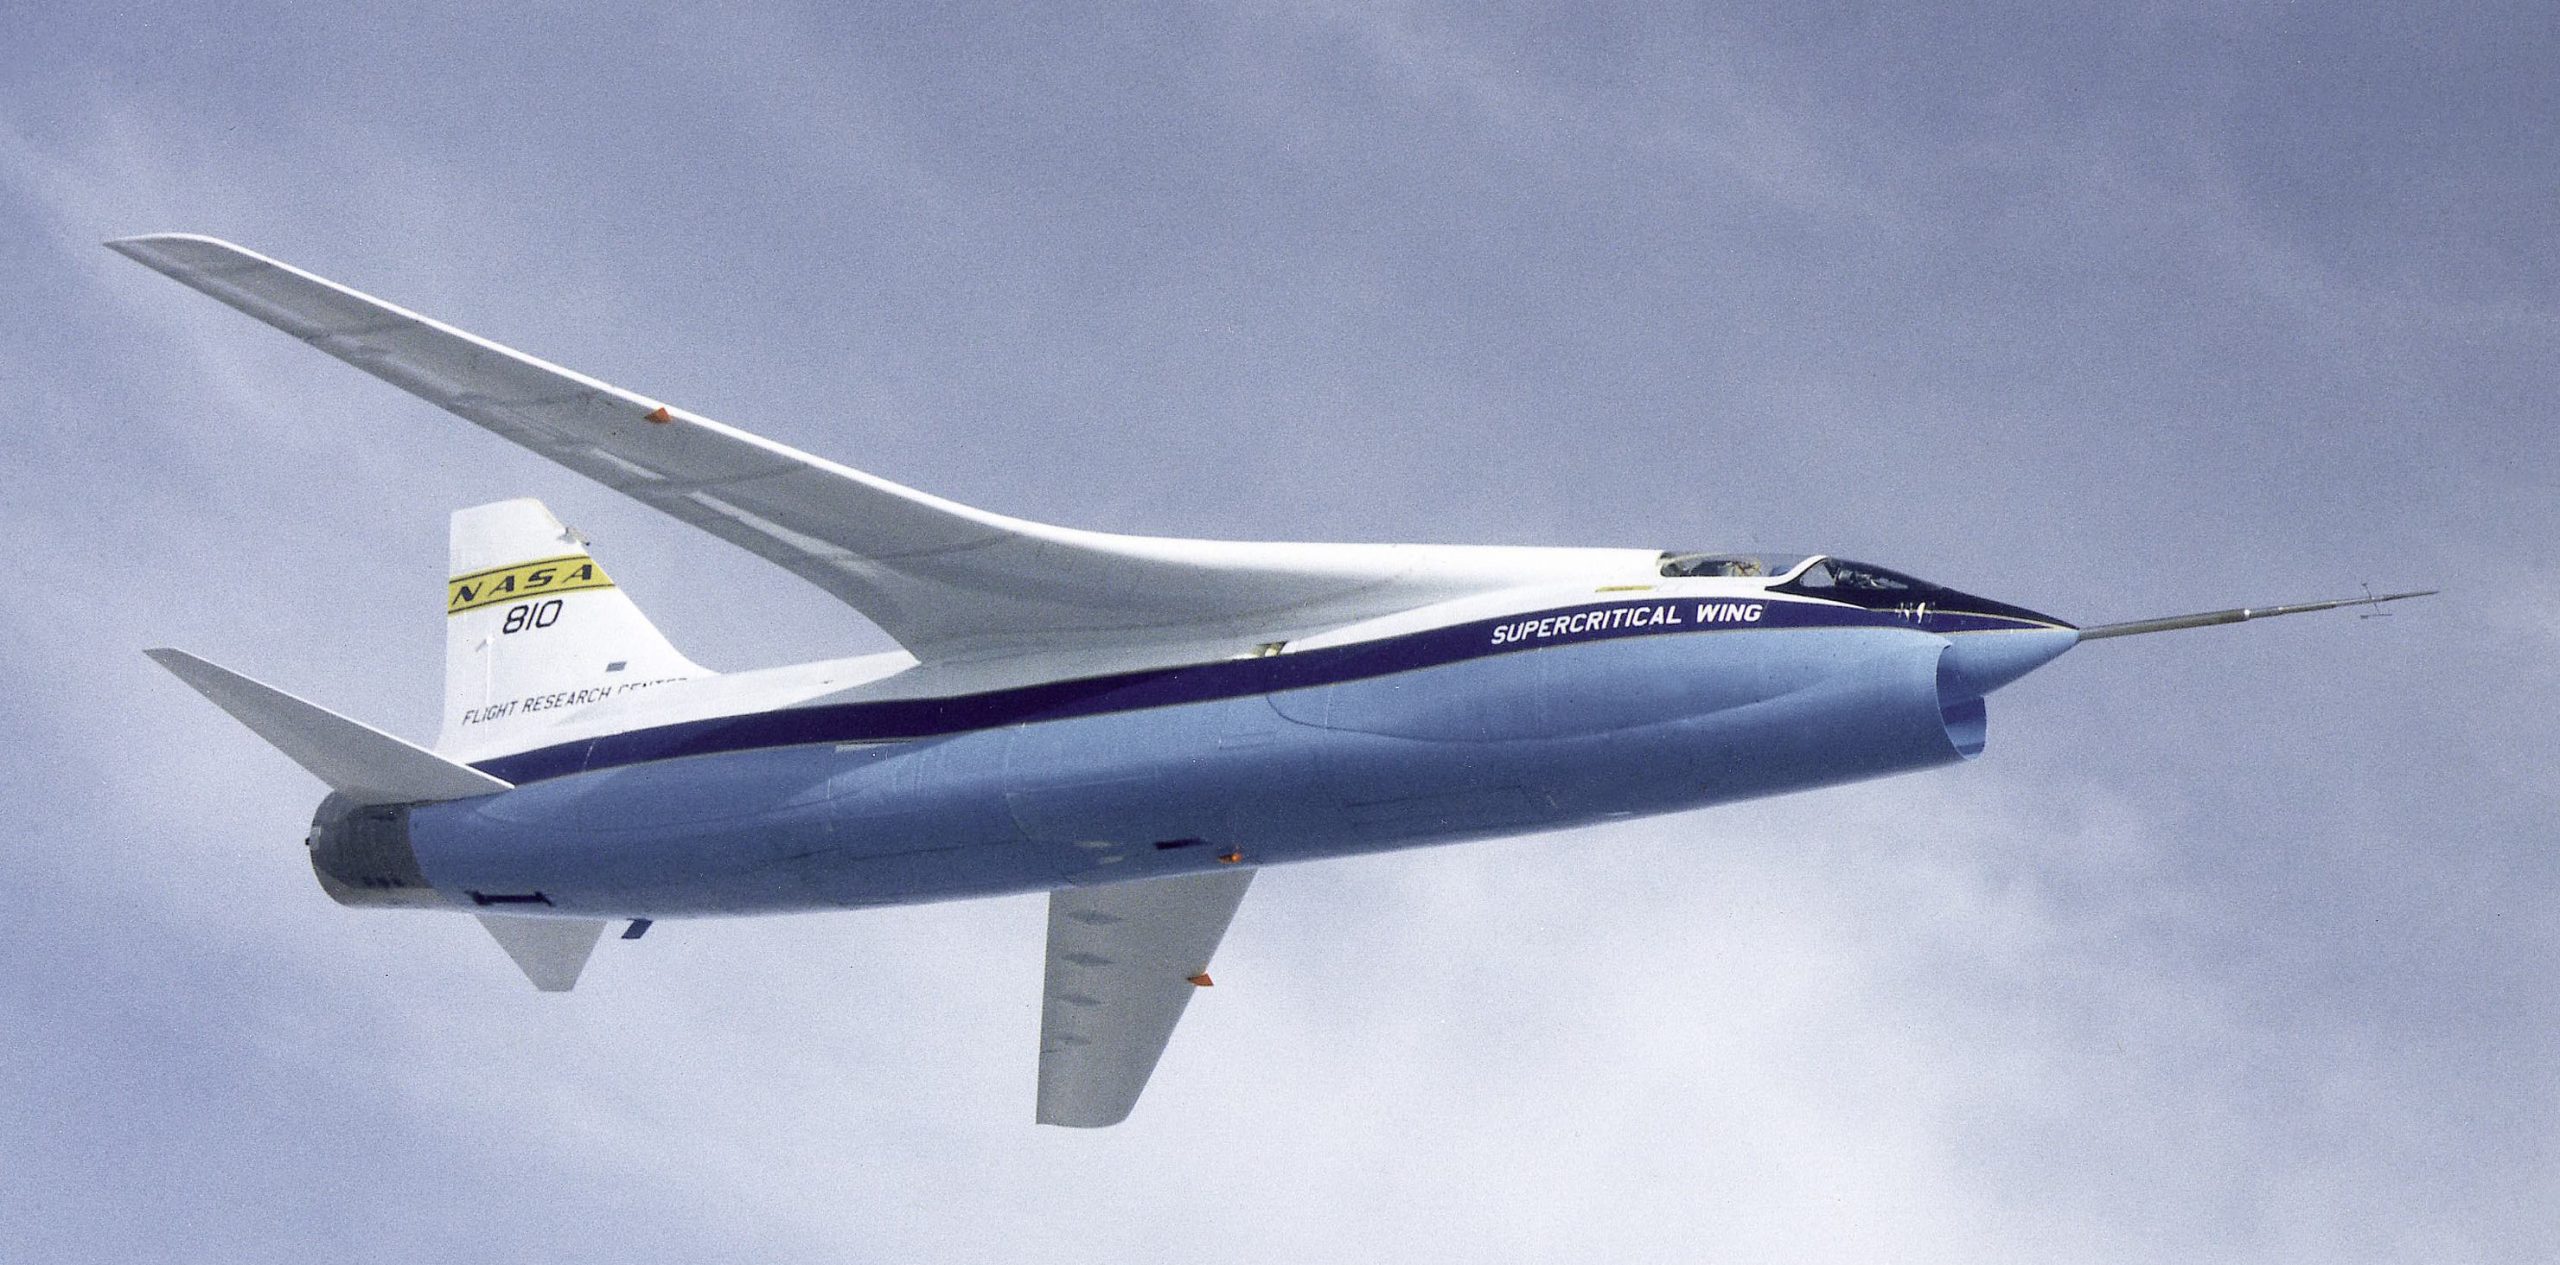
The challenges in reaching higher transonic cruise speeds have led to the design of a unique shape of swept wing called a supercritical wing. The supercritical wing evolved from the careful tailoring of the airfoil section(s) with the overall wing design to delay the formation and reduce the strength of the shock waves over the wing, reducing wave drag. In the early 1970s, with great success, NASA modified an airplane (see photo below) to test a supercritical crescent-shaped planform wing instead of the conventional wing to minimize the effects of shock waves and the creation of wave drag. Results of NASA’s supercritical wing research results showed that aircraft using this concept. Delaying shock wave formation at these higher speeds resulted in less drag, significantly increased cruising speed, and improved fuel efficiency. Since then, aircraft designers have never looked back.
Area Rule
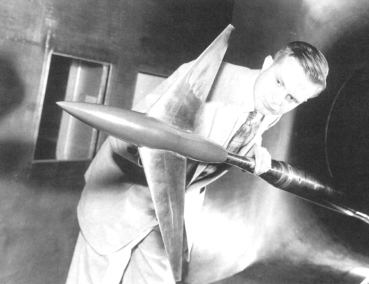
Other ways of reducing wave drag and expanding the airplane’s flight envelope to higher cruise speeds include using the area rule, which Richard Whitcomb developed. The basic design principle behind the area rule is that the airplane’s overall cross-sectional shape should change smoothly with no significant discontinuities to reduce the number and intensity of shock waves over it as it approaches transonic and supersonic flight.
The principle was proven to work in wind tunnel testing, as shown in the photograph below, and then applied retroactively to various airplanes, with successful results after flight testing. Early airplanes modified to validate the area rule had distinctive, if not odd-looking, “waisted” fuselage shapes at the wing root, as shown in the figure below, which were often dubbed ” flying Coke bottles.” Nevertheless, the notable reductions in drag proved the viability of the area rule concept.
Later, airplanes were designed with the area rule in mind. However, they were aesthetically more pleasing because of the blending of the wing root area and the careful positioning of engines, the use of sizeable trailing edge anti-shock wing pods or “canoe” fairings, and other subtle changes to the shape of the airplane to prevent significant changes in effective cross-sectional area. In addition, for many commercial airliners, the wing-mounted “pod” engines are placed relatively far forward from the wings to control the change in the cross-sectional area of the airplane at the wing.
A careful examination of most commercial airliners will show some careful contouring of the fuselage and wing root to help minimize wave drag according to the principles established by the area rule. For the same reason, later versions of the Boeing 747, such as the 800-series, were also modified with an extended upper deck and a shallower transition at its end to keep area changes as progressive as possible.
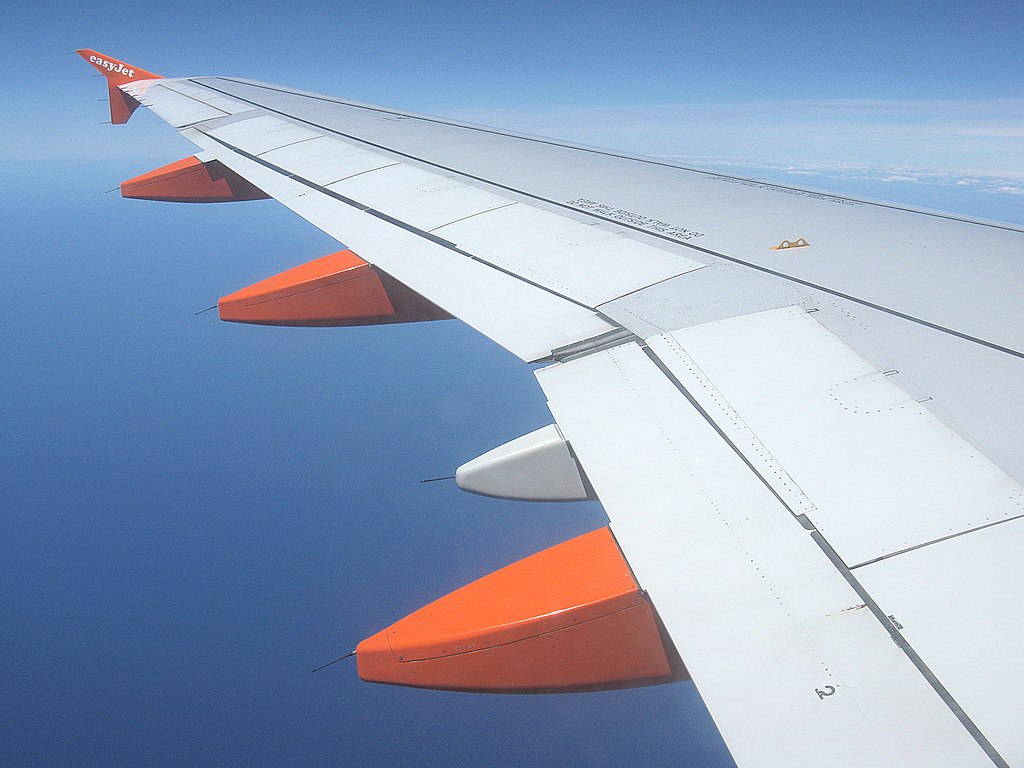
Most airplanes capable of transonic or supersonic airspeeds incorporate design features that can be traced back to the fundamental principles underlying Whitcomb’s area rule. For example, the three orange pods or “canoe fairings” shown in the photograph below are hollow fiberglass fairings that streamline the flap track and actuator mechanisms. However, they are oversized to progressively reduce the cross-sectional area of the aircraft behind the wing and reduce transonic drag per the area rule.
Crescent Wing
One of the wing designs that stands out for its excellent high subsonic and transonic performance is the crescent wing. The figure below shows that crescent wings have smoothly varying wing sweep angles, the sweep angle being highest at the root and then decreasing toward the wing tip. The crescent wing design is an excellent aerodynamic solution for delaying the onset of wave drag and allowing the aircraft to cruise at higher transonic flight Mach numbers.
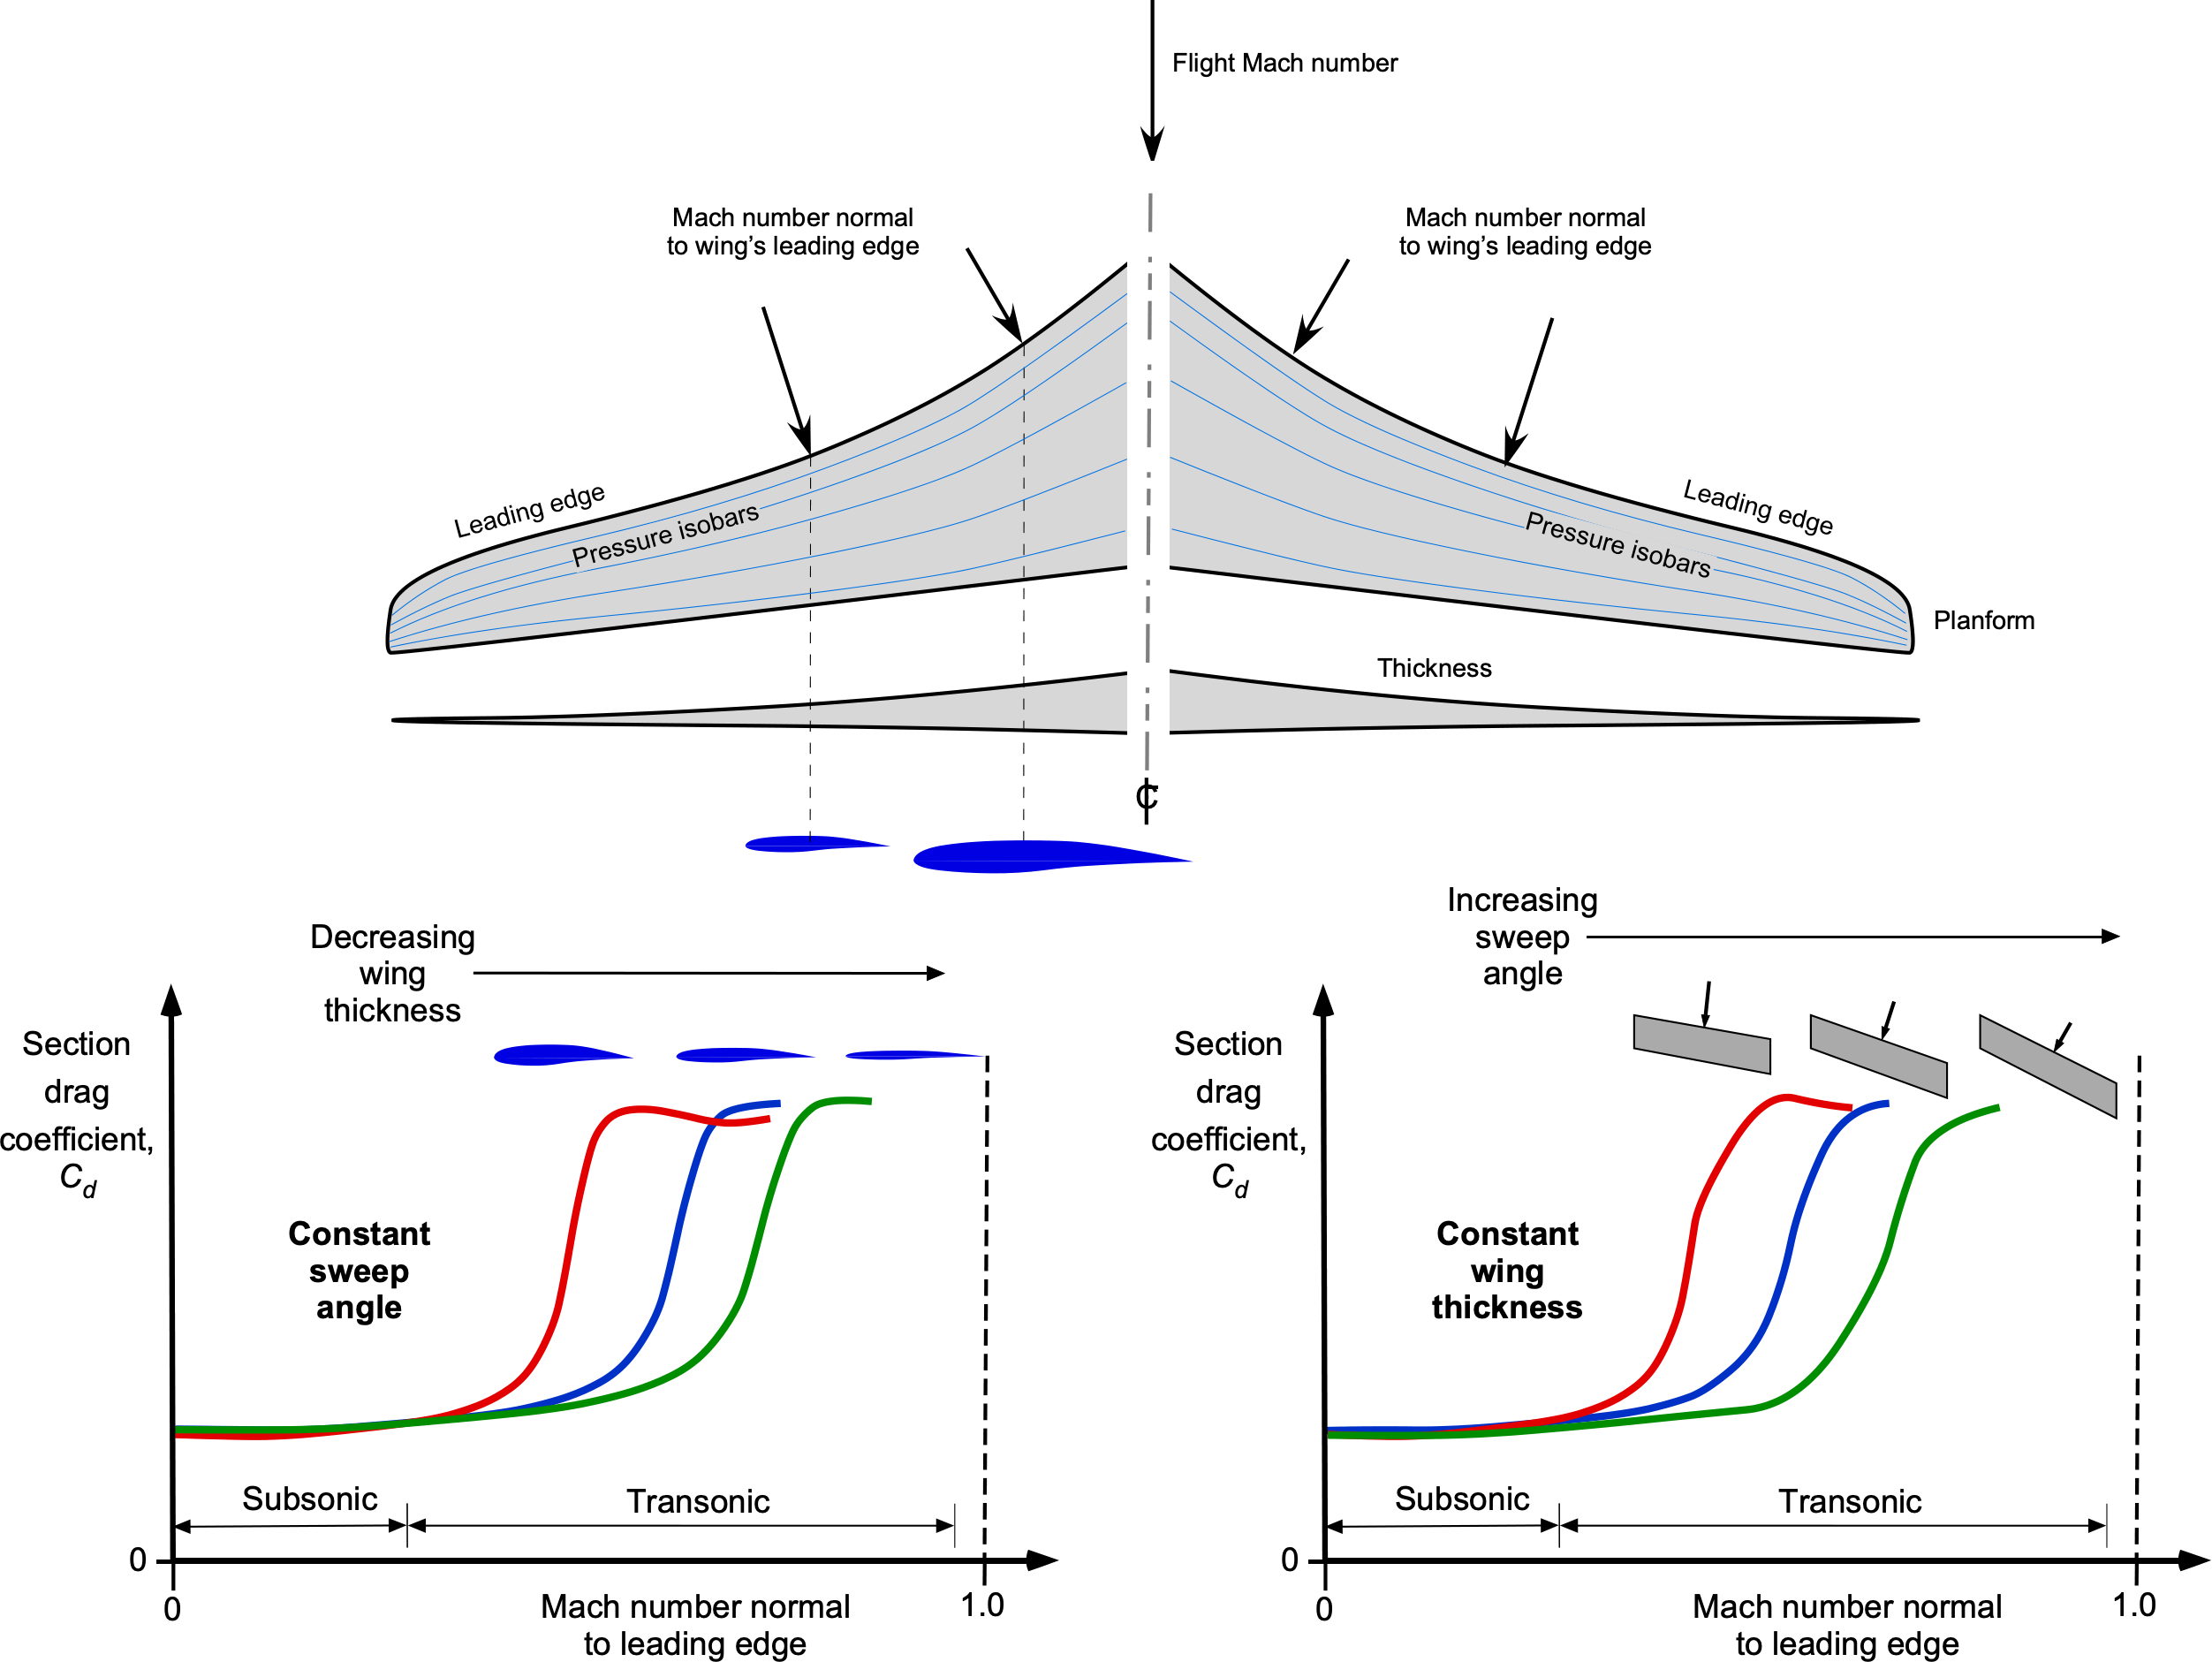
The crescent wing’s design follows the supercritical design philosophy of delaying the onset of drag rise as much as possible. Notice the rapid reduction in wing thickness approaching its tip, which is relatively thin. The structural bending moment on a wing increases toward the wing root with the square of the distance from the wing tip. Therefore, limiting bending stresses necessitates increased wing thickness, which will be roughly proportional to the moment. Wing thickness may also be needed to house the propulsion system and/or landing gear. However, this leads to a problem: the wing thickness at the root becomes high enough there to significantly reduce the critical Mach number of the wing. Consequently, the onset of transonic drag rise will occur at a lower flight Mach number.
The crescent wing attempts to maintain the highest possible cruise Mach number for a given wing thickness by altering the local sweep angle. This approach sweeps the wing more with increasing sectional thickness, maintaining or reducing the Mach number normal to the wing’s leading edge and pressure isobars. The idea is to increase the sweep angle just enough to offset the detrimental effects of increased sectional wing thickness. In addition, because there is a super-velocity and corresponding Mach number produced at the ing root by the fuselage, the additional sweep angle also offsets this effect. While the principle is aerodynamically attractive, such a wing is more complicated and expensive to manufacture. Therefore, there have been few aircraft built with crescent wings.
One notable exception was the British Handley-Page Victor strategic bomber, a significant part of the West’s nuclear deterrent during the 1950s and 1970s. The Victor’s distinctive feature was its almost crescent-shaped wing, which gave it a sleek appearance and excellent aerodynamic performance with cruise Mach numbers of about 0.9. Its high-mounted T-tail also followed the same supercritical design philosophy. The Victor was one of the three “V-bombers” designed by the major British aircraft companies Handley-Page, Vickers, and Avro. A careful examination of the wings on both the Vickers Valiant and the Avro Vulcan will also show the incorporation of certain supercritical design features, the Vulcan essentially having the “delta” equivalent of the crescent wing.
Flight Ceilings
The flight ceiling for an airplane is defined based on a demonstrated rate of climb. The absolute ceiling is determined when the achievable rate of climb diminishes to zero, whereas the service ceiling is defined as the rate of climb that reduces below 100 ft/min. The airplane’s standard performance ceiling is when the climb rate reduces below 200 ft/min. The ceiling is reached when the excess power available over and above that for level flight at the same airspeed and weight becomes diminishingly small.
The ceiling for most commercial transport airplanes is limited by cabin pressurization requirements rather than attainable engine thrust and power, which set a structural stress limit on the fuselage; for most airplanes, the cabin pressure is maintained at an altitude equivalent to about 6,000 to 8,000 ft to allow for good passenger comfort. Nevertheless, some passengers may still exhibit hypoxia symptoms (oxygen deprivation) during extremely long flights over 12 hours, contributing to the disorder known as jet lag. Therefore, the most modern commercial transport airplanes, such as the Boeing 787, maintain cabin pressure at the equivalent of 6,000 ft (i.e., at a higher pressure differential), improving passenger comfort and reducing the effects of jet lag.
Representative Flight Envelopes
The general idea of a flight envelope has already been introduced, although now having learned about the specifics of airspeed and Mach number, stalling, transonic drag rise, and the thrust/power required for flight, the characteristics of the flight envelope of an airplane and why it has inherent boundaries can be better understood. Stalling speeds always define the low-speed end of the envelope, and the onset of transonic drag rise and buffet will define the high-speed end of the envelope. As previously explained, the ceiling is often determined by the allowable differential pressurization, which is a structural limit, not an aerodynamic one.
A representative flight envelope for a commercial subsonic transport (jet) airplane is shown in the figure below, with measured test points also being identified. In this case, the graphs are defined in terms of the airspeed and the flight Mach number, the significance of the Mach number already being discussed. At lower airspeeds, the envelope is bounded by the stalling speeds in the “clean” configuration. The stall region of the flight envelope needs little further elaboration other than it is a complex aerodynamic region involving flight at low airspeeds and high angles of attack, which also depends on how the airplane is configured, e.g., flaps up or down, landing gear up or down, etc. The stall boundary is always defined carefully during flight testing. Usually, many tests are required to establish reasonable confidence that the stall boundary, handling qualities, and other airplane characteristics at the stall have been explored for all flight combinations (e.g., weights and altitudes).
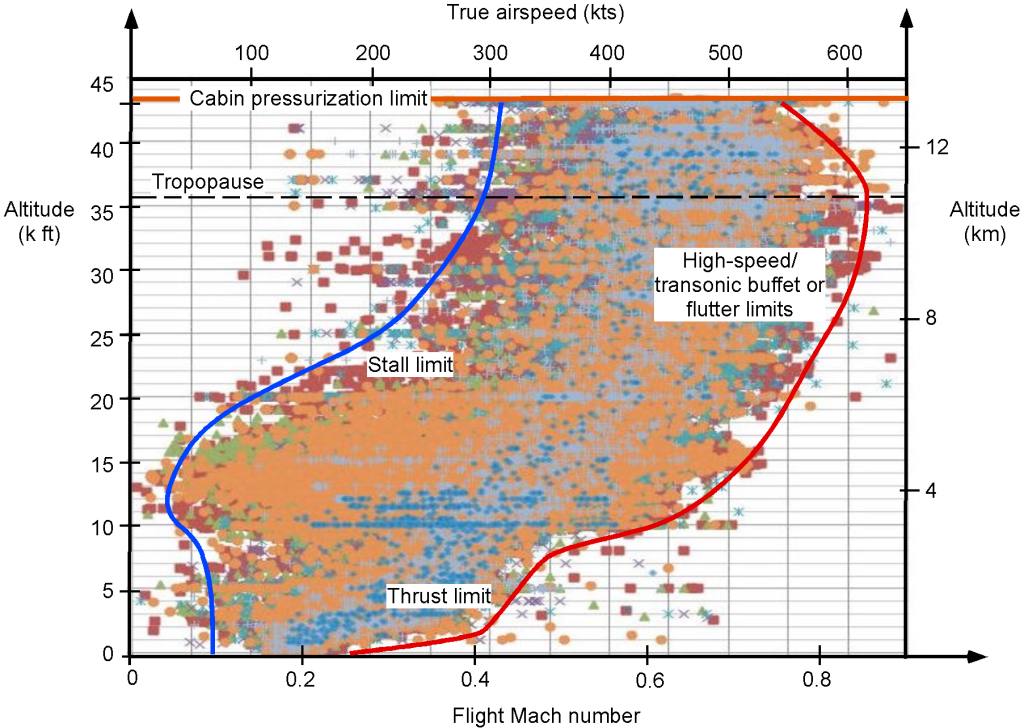
At higher airspeeds, the limits of flight are dictated by the maximum operating Mach number, which is called  , with the corresponding airspeed being called the maximum operating airspeed
  or VMO. In operational service, the airplane will cruise at an airspeed somewhat lower than this recommended airspeed (which will appear in the airplane’s operating manual and procedures).
While fundamental engineering issues are critical, non-engineering factors may limit the usable flight envelope. For example, issues are often centered around financial requirements, manufacturability, passenger ergonomics and safety, airfield requirements, and environmental and noise regulations. For example, an airline always wants to maximize its profit; in this respect, the airplane’s empty weight is critical. The benefit is that not only is the fuel burn lower (i.e., lower costs for a given payload) but the revenue can also be increased by carrying more payload. One reason lightweight composite materials have become critically important in modern aircraft design is the need to take more payload. This is not because composites are necessarily lighter per se but because they can be better tailored to give a better strength-to-weight ratio.
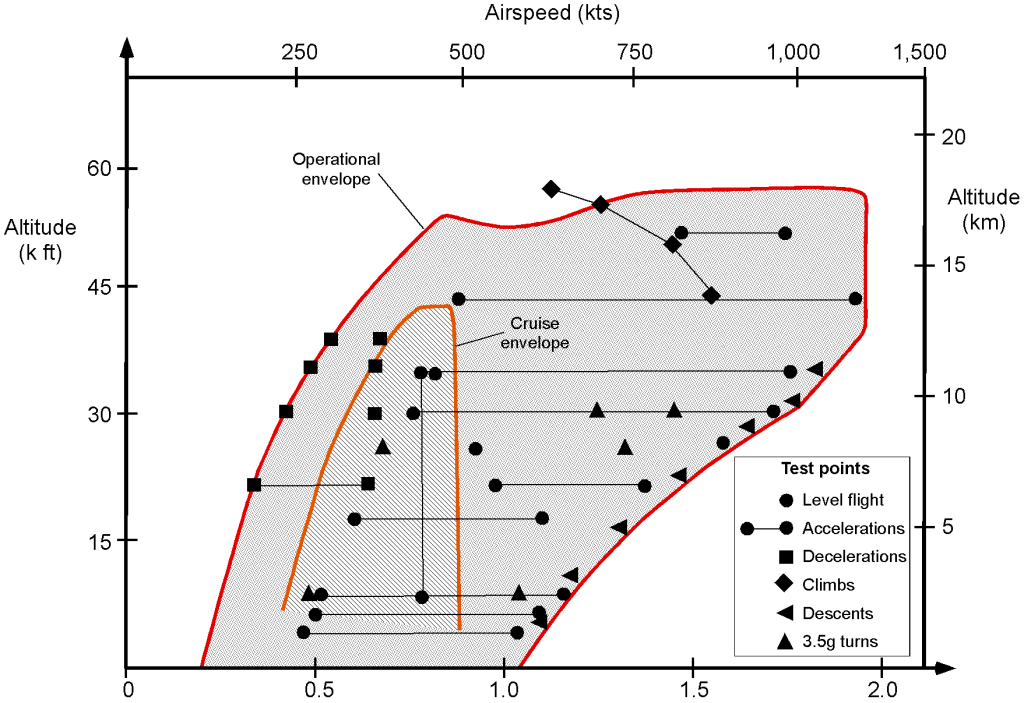
The figure below shows the flight envelope of high-performance jet airplanes that can reach almost supersonic flight speeds, at least at higher altitudes. In this case, the envelope was again established with flight test data, including various types of maneuvers, including accelerations, decelerations, climbs, and descents. Notice this airplane’s relatively broad flight envelope regarding attainable altitudes and airspeeds (Mach numbers). However, such high-performance airplanes tend to expose the limits of aeronautical technology, which tie closely to the limitations imposed by aerodynamics and the strength of the airframe and the engines.
Other Possible Limiting Factors
Engine limitations and aeroelastic effects may impact the flight envelope of airplanes, including airliners. Engines impose thrust and power limits, efficiency constraints at higher altitudes, temperature restrictions, and maintenance requirements to ensure reliability and performance. Aeroelastic effects, such as flutter, divergence, and control reversal, involve instabilities that can lead to structural deformation and failure. These phenomena require careful design considerations and will set critical speed, altitude, and load limits to ensure safe and efficient aircraft operation.
Engine Limitations
The engines themselves may suffer various problems limiting the airplane’s flight boundary, including surge/stall issues and intake buzz. Intake “buzz” is usually associated with supersonic airplanes, which have inlets designed to reduce the flow speeds to subsonic conditions before the flow enters the engine’s compressor stage. If it occurs, the buzz phenomenon involves the interaction between the surface boundary layer flows and the shock waves, which can result in an erratic flow behavior at the intake to the engine.
Engine surges can occur on all jet engines when a stall manifests in the compressor stage. However, the onset is usually precipitated by operating the aircraft at an excessive angle of attack, especially when flying at lower airspeeds, e.g., during takeoff. The phenomenon results in a sudden back pressure through the engine, resulting in unstable engine operation. In some cases, the combustion process is interrupted so that raw fuel burns in the tailpipe, often resulting in a spectacular series of “bangs” with the discharge of smoke and flames.
While serious in that surges cause an immediate loss of thrust, they are usually quickly self-correcting when the conditions that promoted the problem are removed, i.e., by the pilot reducing the angle of attack of the wing and/or increasing airspeed by pushing forward on the control stick. Nevertheless, engine surge conditions have been known to manifest more often during the critical takeoff and climb phases of flight, which always poses a safety-of-flight issue. Usually, an engine that suffers from surging or stalling must be closely inspected for damage before further flight, especially the hot sections.
Aeroelastic Effects & Flutter
Aircraft are flexible structures, and significant structural deformations may occur even during a routine flight. Wing flutter is an aeroelastic phenomenon, a coupling between the aerodynamic loads and the elastic deformation of the structure. Wings and tail surfaces are prone to flutter at higher airspeeds and Mach numbers, although other parts of the airframe, such as the engine nacelles and tail surfaces, may also be susceptible to such problems. Even on a wing, the onset of flutter is not necessarily catastrophic and can manifest as benign (but often alarming) limit-cycle torsional and/or bending oscillations.
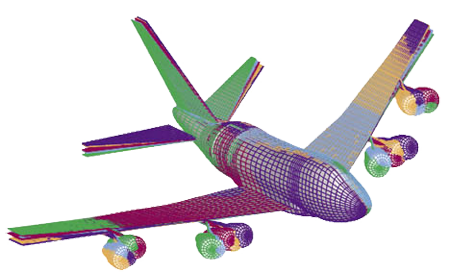
Generally, however, the avoidance of flutter is a crucial design requirement. Therefore, the structural dynamics and potential flutter characteristics of the aircraft’s structure are carefully examined using computer models, the objective being to identify the natural frequencies and modes of deformation, as shown below. The parameters that may affect the onset of flutter on a wing include the geometry of the wing (its span, aspect ratio, thickness, sweep angle, etc.) as well as its structural stiffness, total weight, and weight distribution, positions and weights of the engines, moments of inertia about the bending and torsional axes, etc.
However, flutter developments can still occur even with a good understanding of the flexible airframe. Flutter usually leads to large structural deformations and even structural failure. Because the onset of flutter conditions on an airplane can be potentially catastrophic, wings, in particular, are designed carefully to avoid the problem and verified by flight testing to ensure that flutter will never occur if the airplane is appropriately flown within its standard validated flight envelope.
Summary & Closure
While all aircraft have an operational flight envelope defined by specific airspeeds and altitudes for safe operation, not all aircraft are designed equally. The advent of the supercritical airfoil and its subsequent evolution into the supercritical wing has revolutionized commercial jet aircraft design. Supercritical airfoils are characterized by their distinctive flat top surfaces, which are easily recognizable on modern jetliners. This innovation has significantly expanded the flight envelope of airliners and other high-speed, transonic aircraft, enabling them to cruise more efficiently at higher speeds and altitudes. The improved aerodynamics of supercritical wings reduce drag and delay the onset of shock waves that occur near the speed of sound, which in turn enhances fuel efficiency and performance.
In addition to the supercritical wing, the application of the area rule has further advanced aircraft design. The area rule is a principle that minimizes wave drag, which is a significant source of aerodynamic drag at transonic and supersonic speeds. Engineers can reduce drag and improve efficiency at higher transonic Mach numbers by designing aircraft with a smooth distribution of cross-sectional area along their length. Together, these innovations—the supercritical wing and the area rule—have set new standards in the design and performance of modern subsonic commercial airliners, making them more efficient, faster, and capable of operating safely over a broader range of conditions.
5-Question Self-Assessment Quickquiz
For Further Thought or Discussion
- Think about the nature of the flight envelope for a small, general aviation airplane powered by a reciprocating engine and propeller. What factors limit the maximum flight speed, maximum altitude, and minimum airspeed?
- What factors will limit a turboprop airplane’s lowest and highest achievable airspeeds?
- What operational flight envelope would a typical helicopter have compared to an airplane? A tiltrotor?
- Study photos you can find of the Airbus A380. Can you identify any design features that tie to using the “area rule” in its design?
- What type of flight envelope would a supersonic transport (SST) aircraft have? What factors will or may limit the highest achievable flight Mach number?
Other Useful Online Resources
To learn more about aircraft flight limitations, check out some of these online resources:
- An older but interesting educational film discussing high-speed flight.
- Great video showing the stall patterns on a wing of a GA aircraft.
- Video of stalling a Boeing 737-400.
- National Aerospace Library educational film series:
- To learn more about the supercritical airfoil, see this article by NASA.
- The story of the area rule.
- NASA video – Aviation Pioneer Richard Whitcomb.
- Lecture by Richard Whitcomb.
- Stall testing the MD-11.
- Boeing 787 Dreamliner stall tests.
- Video of flutter testing.
- Video of the structural deformations on a Boeing 747 when flying through turbulence.
- Video of wing flex on a Boeing 737 wing.
