11 Fundamental Properties of Fluids
Introduction
Aerodynamics is the underpinning of atmospheric flight, so understanding aerodynamic principles, or, more generally, fluid dynamic principles, is critical to successfully designing all types of flight vehicles. Aeronautical and astronautical engineers must understand the behavior of fluids under a broad range of conditions. Fluids can be liquids or gases, and air is a gas. To understand the action of aerodynamic flows on flight vehicles, it is first necessary to become intimately familiar with the fundamental physical properties used to describe the behavior of fluids and the relationships between them. This general field is called fluid mechanics[1]. One must learn about fluid mechanics and aerodynamics before a deeper understanding of the other characteristics of flight vehicles becomes possible.
In all branches of science and engineering, physical properties are defined to help describe how things behave in the physical world. For example, mass, weight, energy, work, power, etc., are all essential properties relevant to physical behavior and problem-solving. The pertinent properties of fluids include pressure, density, temperature, viscosity, flow velocity, and the speed of sound. These are also point properties in that their values can change from one spatial location to another in the fluid; they may also vary with respect to time at a given spatial location. These are called macroscopic properties. [2] In this regard, they apply to bulk matter or a finite group of molecules rather than to each molecule, the matter having net physical dimensions much greater than the mean free path[3] between the molecules; this approach is known as a continuum assumption.
Furthermore, it must be recognized that these fluid properties will not be independent of one another, i.e., they will have some interdependencies, often through the effects of temperature. Changing the value of one property inevitably means that the values of other properties may also vary. For example, increasing the pressure of air, such as by compressing it, is accompanied by an increase in density and temperature. The relationships between pressure, temperature, and density can be established using thermodynamic principles and the ideal gas laws, which are formally encapsulated in an equation of state.
Learning Objectives
- Appreciate the continuum model for describing a fluid.
- Become familiar with the parameters used to describe a fluid’s behavior, including pressure, density, temperature, viscosity, flow velocity, and the speed of sound.
- Use the equation of state to relate the properties of a gas, such as pressure, density, and temperature.
- Understand the concept of viscosity and how to calculate the viscosity of a gas using Sutherland’s law.
- Know about the differences between diffusion and effusion of a gas.
- Understand what streamlines are in a flow and how to calculate their locations.
- Know how to calculate the speed of sound in a fluid.
- Appreciate the concepts of surface tension and capillary action and how they can affect the behavior of fluids.
What is a Fluid?
Fluids are substances with mass and volume but have no predefined shape and can easily flow. They can be liquids (e.g., water) or gases (e.g., air). Unlike solids, fluids have relatively mobile molecules, as illustrated in the figure below. In a solid, the molecules are tightly packed in a lattice and have no mobility, except for tiny vibrations around their fixed positions. Solids are primarily rigid and have shapes that are difficult to change under the action of external forces.
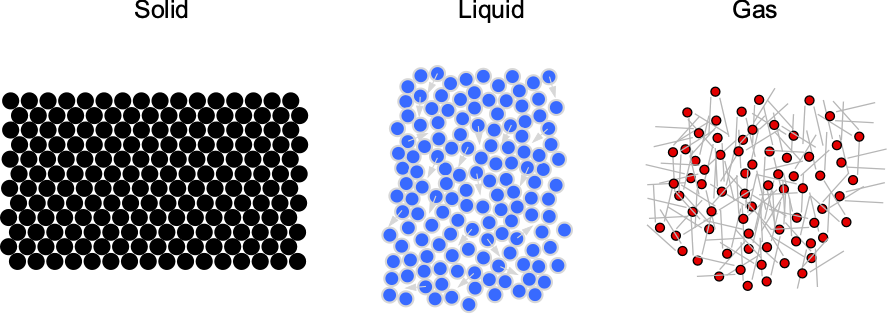
However, the molecules are further apart and much more mobile in fluids. This characteristic means that fluids are easily deformed and will flow readily under the action of external forces. It is the tendency for fluids to flow and continuously deform under the action of an applied force that makes them more difficult to understand. Of particular interest to aerospace engineers is the gas commonly referred to as “air.” Like all gases, air is composed of molecules that are relatively far apart from one another. Air can be compressed relatively easily, which has numerous consequences for the aerodynamic characteristics of flight vehicles.
Concept of a Continuum
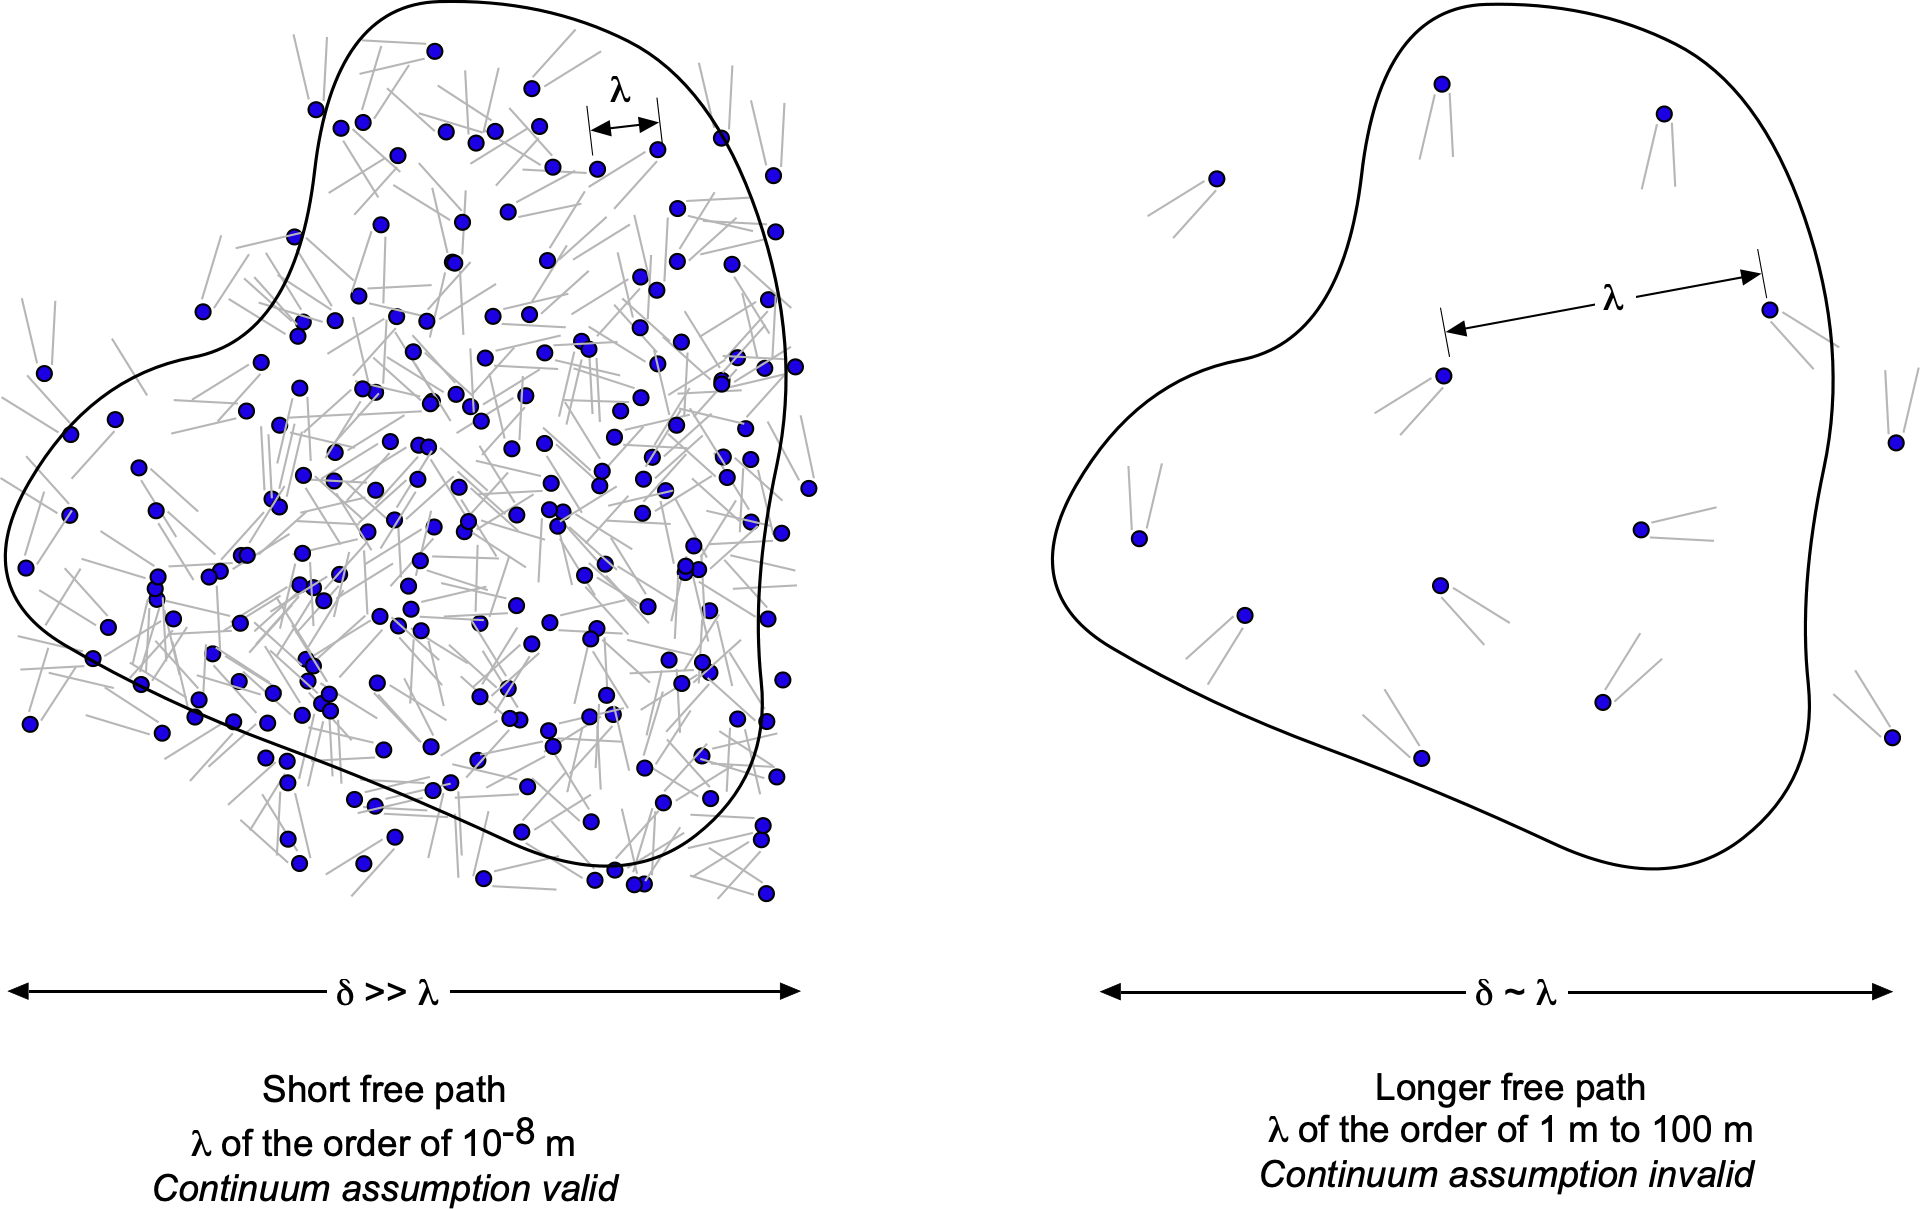
A molecular model of the flow is employed to describe the behavior of a fluid based on the concept of a continuum. In a continuum model, it is assumed that the distance between individual fluid molecules, or more specifically, their mean free path, denoted by the length scale  , is tiny compared to the scale and physical dimensions of the problem,
  , as suggested in the figure below. With a continuum model, the macroscopic fluid properties, such as temperature, density, pressure, and flow velocity, can be considered constant at any point in space and vary continuously from point to point within the physical dimensions of the problem. In a continuum, any local changes associated with individual molecular motion are irrelevant, which is easily justified in most practical cases of fluid flows.
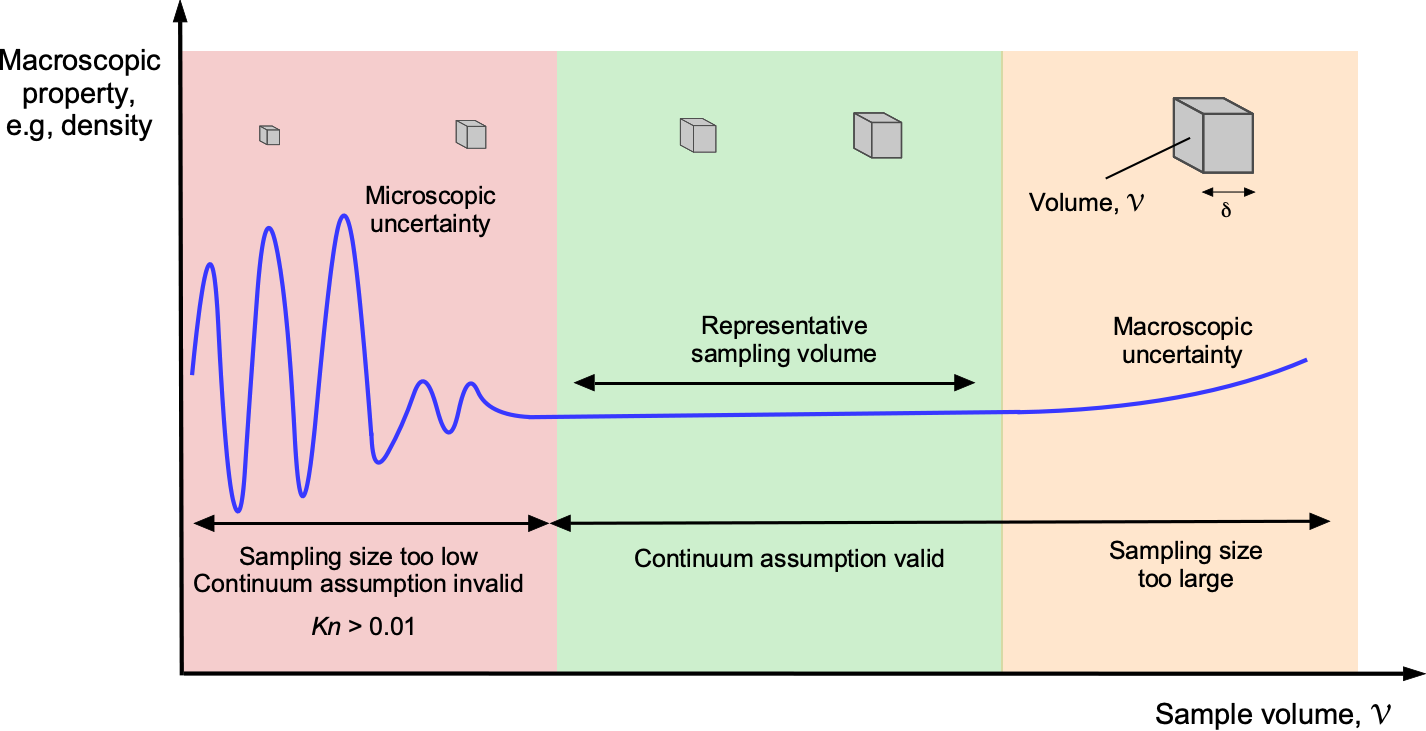
One way to think about a continuum is to consider a measurement volume,  , like a probe used in a wind tunnel to measure pressure. The figure below shows the measurement volume at different scales, . When is very small, it contains only a few molecules, making it difficult to accurately define macroscopic properties such as density, temperature, and pressure. As increases, it encompasses more molecules, allowing the averaged properties to converge to well-defined macroscopic values. This is the essence of the continuum assumption: that at sufficiently large scales, the discrete nature of matter can be ignored, and the material can be treated as a continuous medium. Eventually, as becomes too large, the macroscopic properties can vary within the volume, making it challenging to make a valid measurement of “point” macroscopic properties.
A continuum model is the most common approach used to describe a fluid, and this assumption will be employed throughout this e-book to describe fluid properties. But why does this distinction of a continuum matter for flight vehicles? For a gas such as air in the lower atmosphere, the mean free path is on the order of  m. The physical dimensions of a flight vehicle flying in the lower atmosphere will be many orders of magnitude greater than . Therefore, in this case, the fluid flow around the vehicle can be considered a continuum, and all standard macroscopic properties used to describe a fluid, such as pressure, density, and temperature, would apply.
However, consider a situation where becomes comparable to the length scale of the flight vehicle, such as at the edge of space, where the air density is very low and satellites operate in low Earth orbit. At an altitude of 100 km, ranges from 0.1 to 1 m, while at 300 km, exceeds 100 m. In this context, air molecules are spaced far enough apart that interactions with the vehicle occur infrequently. As a result, the properties will not vary continuously from point to point, meaning the flow cannot be considered a continuum and will behave differently.
The Knudsen number,  , is often used to quantify such low-density flows. The validity of the continuum assumption is inherently tied to the collision rate of the molecules in the gas. Therefore, letting
  represent the intermolecular collision rate or frequency, i.e., collisions per unit time, and
  represent the characteristic flow time, the Knudsen number (which is a non-dimensional similarity parameter) can be defined as
(1) 
Alternatively, if  is the mean molecular speed, is the mean free path (the average distance traveled by a molecule before encountering a collision), and
  represents a characteristic length scale, then
(2) 
Therefore, the ratio of to a characteristic length, , becomes a measure of the degree of departure from a continuum.
Usually, when the value of is larger than 0.01, it has been found that the continuum concept becomes increasingly invalid. When is greater than 0.01 and approaching 1, the conditions can be described as a free molecular flow. Under such conditions, the mean free path of the molecules becomes of the order of or greater than the characteristic length scale, and intermolecular interactions are infrequent. As a result, the gas behavior cannot be explained in terms of macroscopically varying quantities; it must be described using a rarefied gas model, where the behavior of individual molecules must be described, usually through statistical models.
However, the definition of a characteristic length scale may need to be qualified. Choosing a length scale, such as the flight vehicle’s length, provides a global measure of how well the continuum assumption applies at a given flight condition. Another choice is to use a length scale related to the local flow characteristics, in which case the continuum concept may become invalid at different flight conditions, depending on the location in the flow.
Fluid Pressure
Remember that fluid is full of many relatively mobile molecules. In physical terms,[4] the pressure can be thought of as the magnitude  of the force
  produced in a direction normal to this elemental area from the average reaction force (i.e., the time rate of change of momentum) of the molecules per unit time are impacting upon this surface.
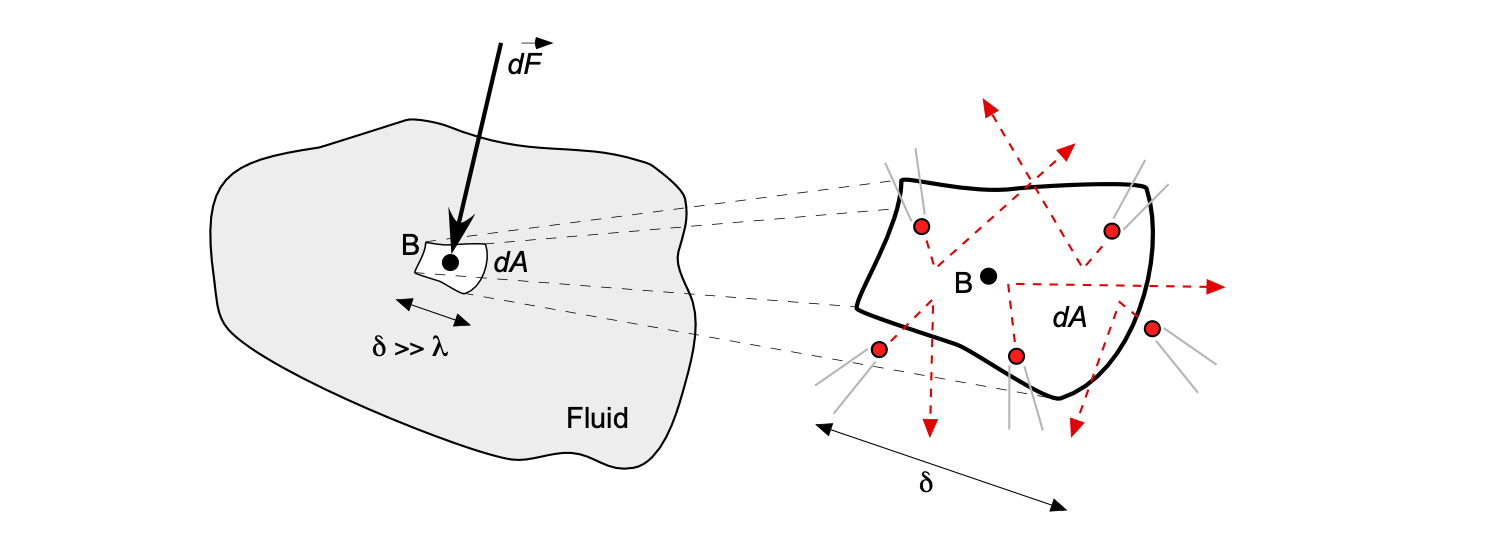
Therefore, the pressure at point B in a fluid can be defined as
(3) 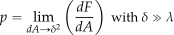
where is a measurable dimension compared to the mean distance between the fluid molecules, i.e., .
This latter definition means that the pressure  is the limiting form of the time-averaged force per unit area as the area shrinks to a point, but that “point” is still big enough to be described by a continuum model. With the assumption of a continuum model, the area cannot shrink to zero because the pressure in the fluid will result from the random movement of individual molecules.
Notice that pressure can be interpreted as a normal compressive force per unit area, which can be recognized as equivalent to a stress. The physical interpretation of pressure assumes that it is caused by the time rate of change of momentum of the fluid molecules, such as when they might strike the walls of a surface or a container. Higher or lower pressure would be associated with more or fewer molecules impacting a given surface area per unit of time. So, a large force must be exerted to create a large amount of pressure on a given area. Alternatively, this same force must be exerted over a small area to get a higher pressure.
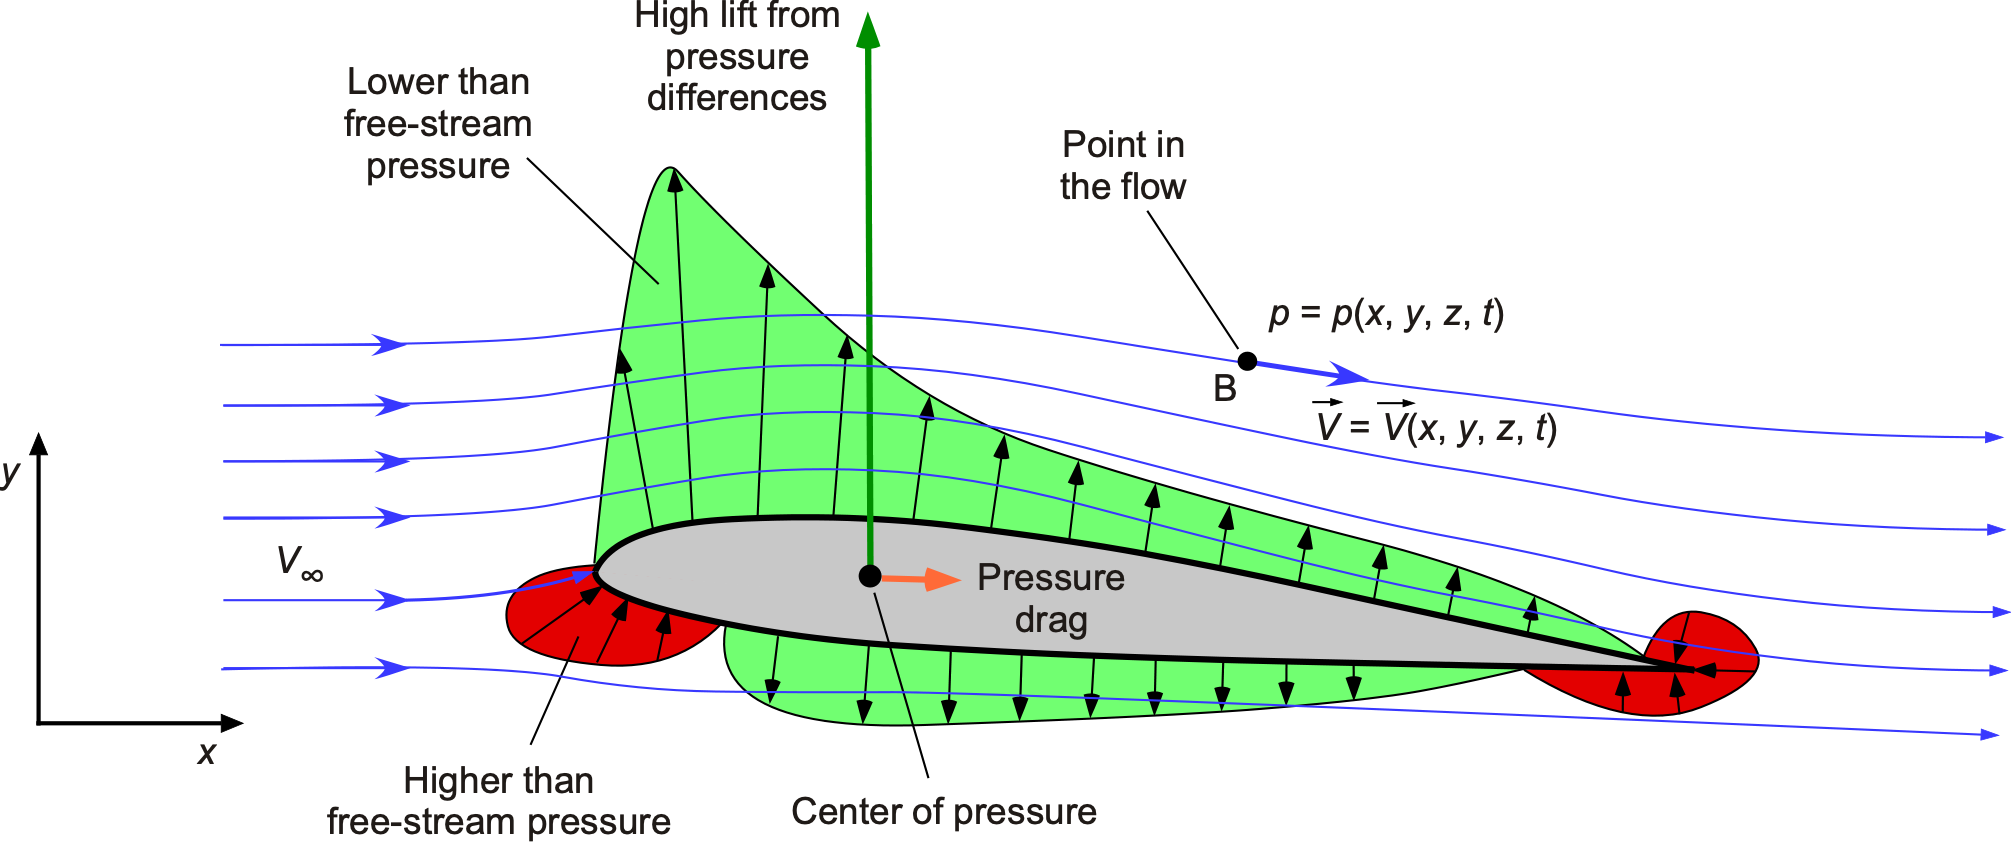
Pressure is also a point property, meaning that its value can differ from one point to another throughout the fluid, e.g., when the flow moves around a shape such as an airfoil section, as shown in the figure below. Well upstream of the airfoil “at infinity,” the flow velocity and pressure are constant, i.e., the velocity is  , and the static pressure is
  . However, both the local velocity and pressure will change near the airfoil. Pressure is also related to other fluid properties, such as flow velocity
  , density,
  , and temperature,
  . Therefore, the pressure becomes a function of the Cartesian spatial coordinates, i.e.,
  . Sometimes, the pressure value at a point may also change over time (the symbol
  denotes time); therefore, pressure can be written more generally as
  . It is also essential to recognize that pressure is a scalar quantity (it has magnitude but no direction), and at a given point, the pressure has the same value in all directions, a principle known as Pascal’s Law.
How is the value of quantified?
The term “measurable dimension” regarding pressure or other point properties can be considered equivalent to the diameter of the tip of one’s pen or pencil, so about 0.5 mm or 0.02 (twenty-thousandths) of an inch. In the wind tunnel, pressure probes, pressure tubing, and the pressure-measuring area of transducers are typically of this dimension. Anything larger means that point properties are not being recorded. Anything smaller means the pressure is acting over an area that is too small for a sufficiently sizable integrated effect to be recorded as a valid measurement.
Units of Pressure
Pressure has engineering units of N m or Pascals (Pa) in the SI system or lb ft (pounds per square foot) in the U.S. Customary (USC) system. In practice, kilo-Pascal (kPa) units may be used because a Pascal is a small pressure value. Units of hectopascals are often used in barometric pressure measurements, where one hectoPascal (hPa) is equal to 100 Pascals. One hPa equals one millibar; one bar is 100,000 Pa or 100 kPa. However, a bar is not an SI unit, and its use should be avoided in most engineering applications unless specifically called for. In the USC system, units of lb in (pounds per square inch) are also common; converting from units of lb in to units of lb ft requires a multiplication factor of 144, i.e. one lb in = 144 lb ft
Pressure as a Force
Sometimes, the effects of pressure may be interpreted as a force, i.e., as a quantity with magnitude and direction. However, pressure can be viewed as a force only when the area and orientation of a surface over which the pressure acts are specified. Therefore, a line of action is also needed to resolve the effects of the pressure and find the force on a surface over which the given pressure acts.
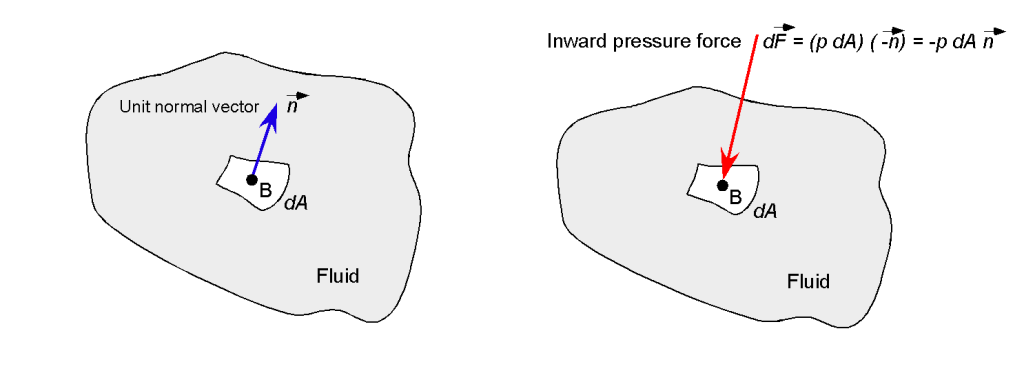
For example, if the small elemental surface had an outward-pointing unit normal vector  , as shown in the figure below, then the pressure force normal to the surface would be
(4) 
where the minus sign indicates that the pressure force will act inward in the opposite direction to the outward pointing direction of  .
.
 .
.What is a physical interpretation of a pressure force?
Consider what happens when you scuba dive in the ocean or dive deeply into a swimming pool. The pressure exerted by the water above feels like a squeezing force on one’s body. Water is three orders of magnitude denser than air, meaning it has many times more molecules per unit volume. Therefore, only relatively small changes in depth are required for one’s body to feel significant changes in pressure. One will feel this pressure first on the ears, which are very sensitive to pressure changes; they respond over several orders of magnitude. The Eustachian tubes, also known as the auditory tubes or pharyngotympanic tubes, are a narrow passage that connects the middle ear to the back of the nose, helping to regulate external pressure. When the pressure outside the ear changes, one may feel discomfort or even pain as one’s ears adjust to the increased pressure, which can be achieved by yawning or swallowing. The opposite occurs when one returns to the surface, which also requires adjusting the differential pressure in the Eustachian tubes to match atmospheric pressure.
Check Your Understanding #1 – Calculation of a pressure force
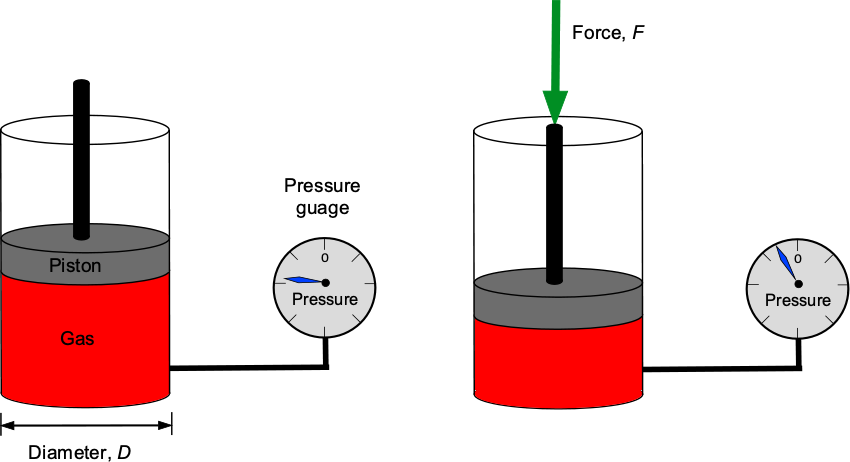
A piston pushes down on a trapped volume of gas in a cylinder with a diameter of 3 inches. A pressure gauge measures the pressure in the gas to be 11 lb/in2. What is the force applied to the piston? Repeat the problem in SI units if the piston diameter is 76 mm and the pressure is 75.8 kPa.
Show solution/hide solution.
By definition, pressure, , is the force,  , divided by area,
  , so
, so
![\[ p = \frac{F}{A} \]](https://eaglepubs.erau.edu/app/uploads/quicklatex/quicklatex.com-3db4bb0d806d4233410b81c11df79ccf_l3.svg "Rendered by QuickLaTeX.com")
which can be assumed to act uniformly. The area of the piston is
![\[ A = \frac{\pi D^2}{4} = \frac{\pi \times 3.0^2}{4} = 7.07~\mbox{in${^{2}}$} \]](https://eaglepubs.erau.edu/app/uploads/quicklatex/quicklatex.com-033ba4bb3176e51fc5feb5651c97768b_l3.svg "Rendered by QuickLaTeX.com")
Therefore, the force in USC units will be the pressure times the area, i.e.,
![\[ F = p \, A = 11.0 \times 7.07 = 77.76~\mbox{lb} \]](https://eaglepubs.erau.edu/app/uploads/quicklatex/quicklatex.com-5e96f7b1fe7679675bfb57b2a8b79bfe_l3.svg "Rendered by QuickLaTeX.com")
In SI units, then  = 76 mm and = 75.8 kPa, so the force will be
![\[ F = p \, A = 75.8 \times 10^3 \times \frac{\pi \times 0.076^2}{4} = 343.9~\mbox{N} \]](https://eaglepubs.erau.edu/app/uploads/quicklatex/quicklatex.com-767bf3a36ec655e14409c4b3ac65f474_l3.svg "Rendered by QuickLaTeX.com")
Fluid Density
Another essential property to describe a fluid’s characteristics is its density, given the symbol or  . Because the symbol used for pressure looks similar to , it is better to use for density to preserve clarity, especially when and are used in the same equation.
Again, consider some point B in the fluid, as shown in the figure below. Let  be an elemental volume surrounding point B, and
  is the associated mass of fluid inside . In the continuum assumption, millions of molecules will remain within the small elemental volume. Density is defined as the mass of a fluid per unit volume, which measures the number of molecules per unit volume. Mass is usually given the symbol
  . Volume is given the symbol
  , i.e., a curly form of “V.” Notice: Do not confuse volume with velocity
  , the latter usually being written in vector form, i.e., .
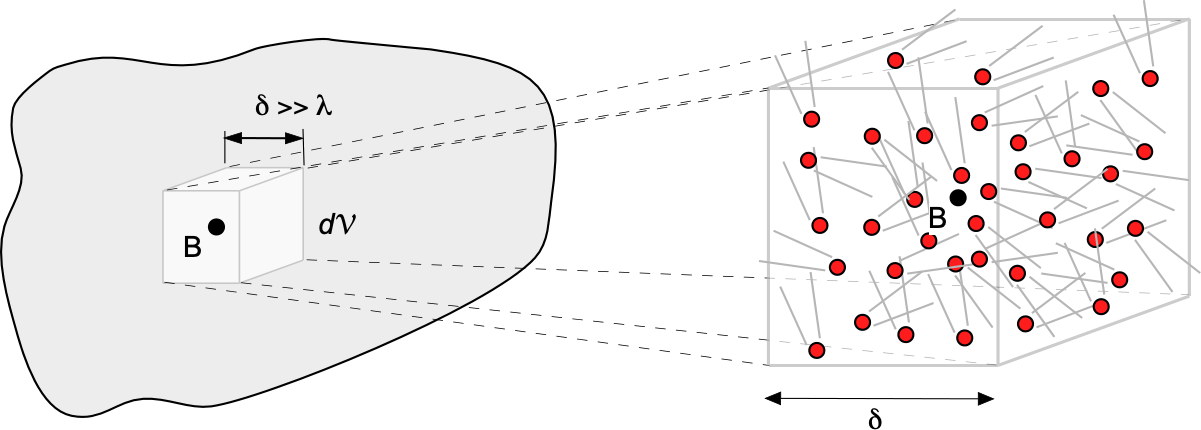
The density of the fluid at point B is formally defined as
(5) 
where is a large linear dimension compared with the mean distance between the molecules . Therefore, flow density refers to the ratio of the mass of a small volume of fluid to the volume that contains it. Flow density is also a scalar quantity, and, in general, like pressure, it can be written as  .
.
Units of Fluid Density
Fluid density has units of kg/m (or more appropriately as kg m
 ) in the SI system or slugs ft in the U.S. customary or USC system, where the slug is the base unit of mass.[5][/footnote] In dealing with aerodynamic problems, it is helpful to remember that air has a density of 1.225 kg m or 0.002378 slugs ft at sea level standard temperature and pressure. These values are at mean sea level (MSL) as defined in the International Standard Atmosphere (ISA) and are usually designated as the symbol
  .
.
Other types of measurement values of fluid density may be used in practice, mainly when dealing with liquids, which may be referenced to the density of water. These values include specific volume, specific weight, and specific gravity.
Specific Volume
The specific volume of a fluid is the reciprocal of its density and is given the symbol  or
or  and can be expressed as
(6) 
The units of specific volume are volume per unit mass, so m/kg (i.e., m kg ) in the SI system, or the USC system it will have units of ft/slug (i.e., ft slug).
Specific Weight
The specific weight is the weight of a unit volume of a fluid. It is often denoted by the symbol  or
or  , i.e.,
(7) 
Specific weight has units of weight per unit volume, so its value depends on acceleration under gravity or “g.” The units of specific weight are N/m (i.e., N m) in the SI system or lb/ft (i.e., lb ft) the USC system.
Specific Gravity
When dealing with liquids, their density is often measured relative to another fluid, called the specific gravity,  . Usually, the reference is the density of water, so
(8) 
Notice that specific gravity is a non-dimensional or unitless quantity. is the most common alternative measurement of fluid density.
Fluid Temperature
The temperature in a fluid is given the symbol and is related to the average internal energy of the molecules at that point in the fluid. Temperature affects fluid properties differently, depending on whether the fluid is a liquid or a gas, as well as its molecular composition. Temperature plays a vital role in aerodynamics, where the air is compressible, and aerodynamic heating from frictional effects can occur.
Again, the molecular model can help explain the concept of temperature. This relationship is typically written as  , where
  is known as Boltzmann’s constant, which serves as the conversion factor that connects energy to temperature. The Boltzmann constant is defined as 1.380649×10⁻²³ J K−1 in SI units, the Joule (J) being the unit of energy. Therefore, as shown in the figure below, a higher-temperature fluid would be one in which the molecules move about at relatively high speeds. In contrast, a lower-temperature fluid would be one with relatively low molecular speeds. Temperature is also a point scalar property. In general, the temperature in a fluid will vary from point to point; temperature may also vary with time at a given point, i.e.,
  .
.
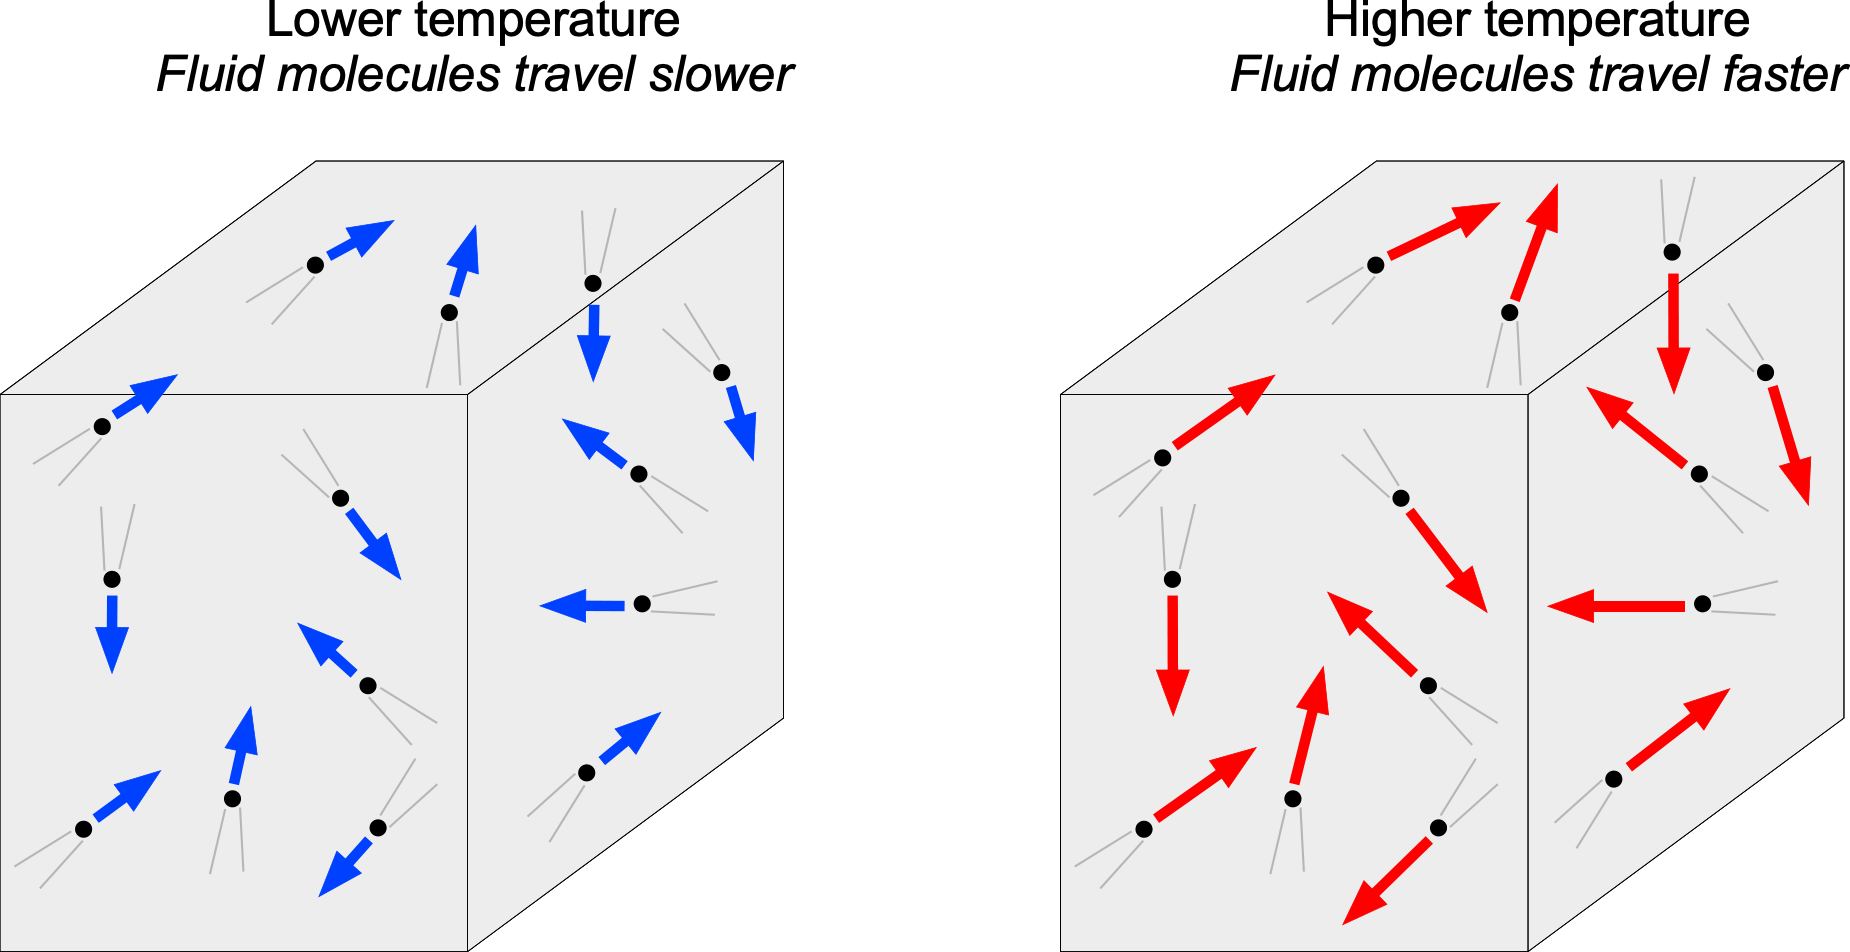
The relationship that the total energy strictly holds for monoatomic gases, which have three degrees of translational freedom, i.e., kinetic energy only. Diatomic gases, such as nitrogen and oxygen, which comprise approximately 98% of air, also exhibit two degrees of rotational motion and two degrees of vibrational motion, the latter being important only at higher temperatures. Therefore, their total internal energy will be related using  at lower temperatures and
  at higher temperatures.
Units of Temperature
Two fixed points are taken to construct a temperature scale. The first fixed point is the freezing point of water, called the lower fixed point or  . The second fixed point is the boiling point of water, which is called the upper fixed point or
  . Temperature is measured in units of Centigrade or Celsius
  C or Kelvin, K or K, in the SI system or Fahrenheit F or Rankine, R or R, in the USC system.
Celsius or Centigrade Scale
This scale was devised by Anders Celsius in 1710. The interval between and is 100 units, where each unit is called one degree Celsius ( ). In this scale, then the lower fixed point is = 0C (freezing point of water), and the upper fixed point is = 100C (boiling point of water).
Fahrenheit Scale
This scale was devised by Gabriel Fahrenheit in 1717. The interval between and is 180 units, where each unit is called one degree Fahrenheit ( ). In this scale, then the lower fixed point is = 32F and the upper fixed point is = 212F.
Kelvin Scale
This scale was devised by William Thomson (later Lord Kelvin) in 1848. The zero temperature is absolute zero[6] on this scale. It is the thermodynamic scale for use in SI units. The interval between and is 100 units, where each unit is called one degree Kelvin ( or
or  ). In this scale, then the lower fixed point is = 273.15K, and the upper fixed point is = 373.15K.[7]
Rankine Scale
This scale was devised by William John Macquorn Rankine in 1859. On this scale, the zero temperature is also equivalent to absolute zero. It is the thermodynamic scale for use in USC units. The interval between and is 80 units, where each unit is called one degree Rankine ( R or 1 R). In this scale, then = 492.67R, and = 672.67R.
Temperature Scale Conversions
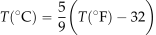
Converting from one temperature scale to another is straightforward because they are all linearly related, as shown in the figure below; this figure should not be used for numerical calculations. Converting to Centigrade or Celsius C from Fahrenheit F is performed using
(9) 
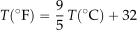
Converting to Fahrenheit  from Centigrade or Celsius
  uses
uses
(10) 
Converting to Kelvin K from Centigrade or Celsius uses
(11) 
Finally, converting to Rankine R from Fahrenheit uses
(12) 
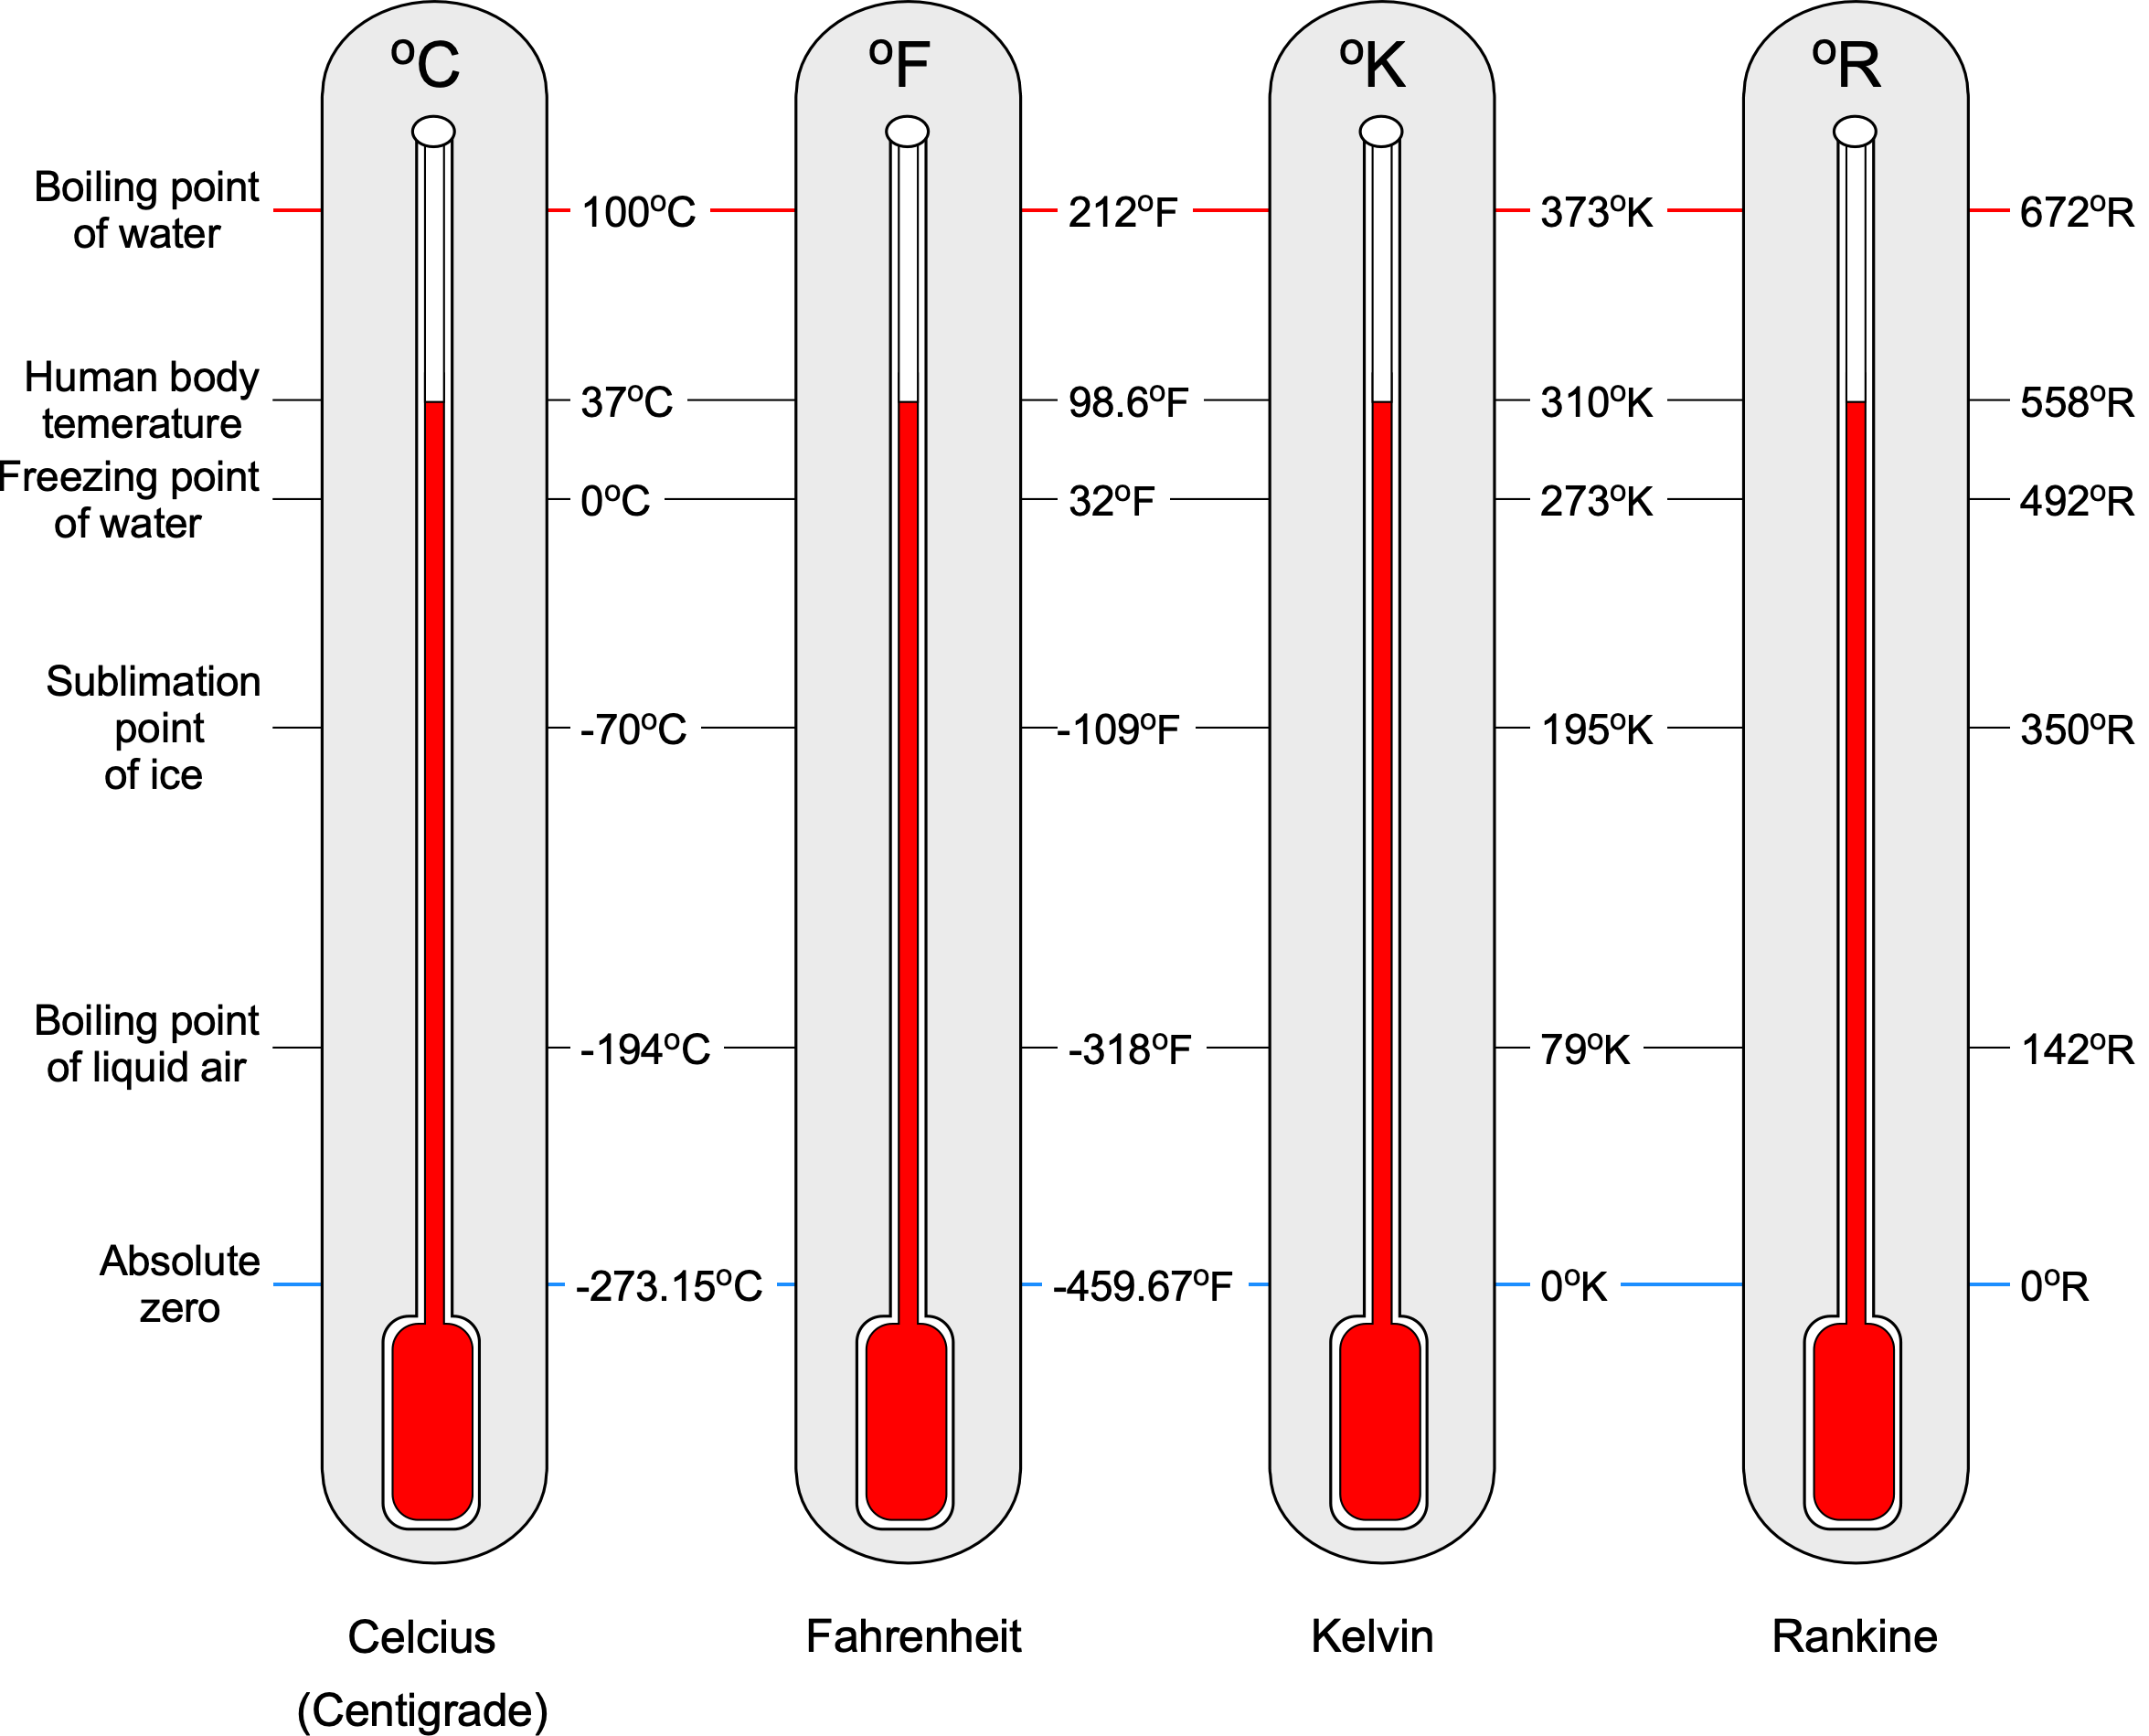
Notice that it is often suggested that the degree symbol () not be used when citing temperature units (especially for the Kelvin and Rankine scales). However, many publications can be found with and without the degree symbol. Nevertheless, retaining the degree symbol on the temperature units is entirely acceptable for students and others when working on aerodynamic problems. Finally, it is helpful to remember the standard sea level values of temperature (based on the ISA model), usually given the symbol  , which are 15C = 59F = 288.15K = 518.67R.
Using Temperatures in Engineering Problem-Solving
In engineering problem-solving, caution should be applied so that the correct absolute (engineering) units of temperature are used, i.e., units of Kelvin or Rankine, because these scales measure the temperature relative to absolute zero temperature, i.e., the temperature when the average internal energy and motion of the molecules becomes effectively zero. For example, for two temperatures 
 and
and  = 40, then the ratio
  is written correctly as
(13) 
but incorrectly as
(14) 
Why two absolute temperature scales?
Using two absolute temperature scales is a historical outcome of different conventions and preferences in various fields, including physics and engineering. The Kelvin (K) absolute temperature scale, proposed in 1848 and based on the Celsius (C) unit, is named after Sir William Thomson, a professor of natural philosophy (physics) at the University of Glasgow, who later became Lord Kelvin. Interestingly enough, Kelvin was skeptical of the future of aviation, refusing to join the Royal Aeronautical Society, stating that “I have not the smallest molecule of faith in aerial navigation other than ballooning or of expectation of good results from any of the trials we hear of.” The Rankine (R) scale, also an absolute thermodynamic temperature scale, was proposed in 1859 based on the Fahrenheit (F) unit. This scale is named after William J. M. Rankine, the first University of Glasgow engineering professor.
Combined Gas Equation & Equation of State
Having introduced the concepts of pressure, density, and temperature, it is also essential to recognize that these quantities have interdependencies, i.e., changing one value affects the others. In physics and chemistry, there are four fundamental gas laws: Boyle’s Law, Charles’s Law, Gay-Lussac’s Law, and Avogadro’s Law. These are all empirical gas laws because their relationships were derived from laboratory experiments with gases.
Gas Laws
Boyle’s law states that for a constant mass, the volume of the gas is inversely proportional to its pressure, i.e.,
(15) 
where conditions 1 and 2 refer to the initial and final conditions, respectively.
Charles’s law states that for a gas at a constant pressure, its volume is proportional to temperature, i.e.,
(16) 
Gay-Lussac’s law states that at a constant mass and volume, pressure is proportional to temperature, i.e.,
(17) 
Combined Gas Law
These three laws can be combined, leading to the combined gas law, which is written as
(18) 
This is a thermodynamic equation. All gases have properties that can be measured, including their pressure, temperature, and volume. Numerous scientific experiments and careful measurements have determined that these variables are quantifiably related. For a given mass of gas, if any two properties can be determined (i.e., measured or calculated), the combined gas law can be used to determine (calculate) the other.
Equation of State
Avogadro’s law states that the amount of a gas, usually in terms of moles, is proportional to its volume at constant pressure and temperature, i.e.,
(19) 
where  is the mass of the gas expressed in moles. Remember that 1 mole = 6.022
 10
10 atoms, which is called Avogadro’s number,[8]
  , so a mole (a base unit) expresses the density of the gas.
These preceding relationships are now formally embodied in an equation of state, which determines the quantitative relationships between a gas’s pressure, density (or mass and volume), and temperature. In physics and chemistry, people inevitably first come across the use of the general or universal equation of state for a gas, i.e.,
(20) 
where  is called the universal gas constant, which is the same for all gases. The universal gas constant, , is related to the Boltzmann constant,
  , by
, by  .
.
However, this latter equation of state is not particularly useful for engineering purposes, especially for finding and relating fluid properties at a point. But, if both sides of this general equation are divided by the mass of the gas, then the volume now becomes the specific volume, , which is the reciprocal of the density of the gas. Recall that the “specific” in the term specific volume means “divided by mass,” i.e.,
(21) 
Therefore, an alternative but equivalent equation of state for a gas can be written as
(22) 
which is more usually written as
(23) 
Equation 23 is the usual form of the equation of state used in engineering, gas dynamics, and aerodynamics. Notice also that this result is independent of the volume of the considered gas. However, in this case, another (different) gas constant,  , is used, which equals the universal gas constant divided by the gas’s mass per mole, i.e.,
(24) 
Therefore, the value of in Eq. 23 is not universal and depends on the gas type; in this case, the value of the gas constant is specific to the gas. Subsequently, caution should be exercised to ensure that the correct value of is used in engineering calculations for each gas being considered, along with the proper units.
However, it is useful to remember that all the forms of the equation of state are equivalent, i.e.,
(25) 
and which version to use depends, in part, on the problem being solved. Because point properties are often desired in engineering problems with fluids, the most common form of the equation of state is
(26) 
What are the units of the gas constant?
In SI units, the gas-specific constant , is measured in J kg K. In USC, the units of are ft-lb slugR. A consistent set of units must be used throughout engineering calculations, with base units of mass, length, and time being preferable. Remember that a Joule (J) is equivalent to a Newton-meter (N m), so it has base units of kg m s.
s.
The main advantage of the equation of state in the engineering form is that if the values of two quantities are known, e.g., pressure and temperature, which are both easily measured, it allows the calculation of the other quantity, i.e., the density, which is obtained from the equation
(27) 
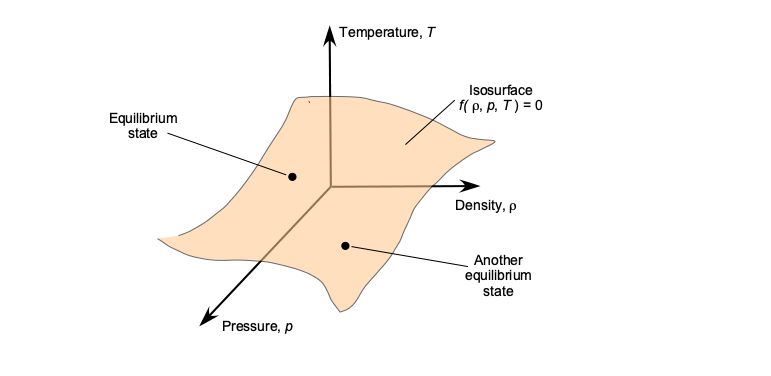
Therefore, using the equation of state reduces the number of independent quantities from three to two. The equation of state can be interpreted as a two-dimensional surface in the , and state space, i.e., a surface defined by a function  , as shown in the figure below, so that every point on the surface represents a unique equilibrium thermodynamic state of the gas.
Strictly speaking, the preceding equation of state in Eq. 23 applies only to an ideal gas, i.e., one where the molecules are sufficiently far apart that intermolecular bonding forces are relatively low and that intermolecular collisions are perfectly elastic. Under what might be called “normal conditions,” at temperatures and pressures reasonably close to standard atmospheric conditions, air behaves like an ideal gas. Generally, a gas nearly always acts as a perfect gas at normal to moderate temperatures and/or pressures. It behaves less ideally at very low temperatures and/or high pressures.
Check Your Understanding #2 – Calculation of air density
During measurements in a wind tunnel, the pressure and temperature of the air are found to be 102.3 kPa and 15.7C, respectively, in SI units. Calculate the air density in the tunnel. Repeat the problem if the pressure is measured in USC units as 14.61 lb in (pounds per square inch or psi) at a temperature of 71.1F.
Show solution/hide solution.
Because this question involves pressure, temperature, and density, we will use the equation of state, i.e.,
![\[ p = \varrho \, R \, T \]](https://eaglepubs.erau.edu/app/uploads/quicklatex/quicklatex.com-cff84f3130a2abf8502dc6b70639140e_l3.svg "Rendered by QuickLaTeX.com")
where is pressure, is density, is absolute temperature, and is the gas constant, in this case, for air. Rearranging for the density gives
![\[ \varrho = \frac{p}{R \, T} \]](https://eaglepubs.erau.edu/app/uploads/quicklatex/quicklatex.com-bf2e29fe4ea2b8bb8a499cff47257977_l3.svg "Rendered by QuickLaTeX.com")
The first part of the problem is in SI units. In this case, the absolute temperature is 15.7 + 273.15 = 288.85 K. The gas constant for air in SI units is 287.057 J kg K so the density of the air will be
![\[ \varrho = \frac{p}{R \, T} = \frac{102.3 \times 10^3}{287.057 \times 288.85} = 1.2304~\mbox{kg m${^{-3}}$} \]](https://eaglepubs.erau.edu/app/uploads/quicklatex/quicklatex.com-53ecd71530274cff4c3705d4e776a7a7_l3.svg "Rendered by QuickLaTeX.com")
Remember that for engineering calculations, we must always use absolute temperature.
The second part of the problem is in USC units. In this case, the absolute temperature is 71.1F + 459.67 = 530.77 R. The pressure is given in terms of common units of pounds per square inch (psi), so to convert to base USC units of pounds per square foot (psf or lb/ft), it is necessary to multiply by 144. The gas constant for air in USC units is 1716.49 ft-lb slugR, so the density of the air will be
![\[ \varrho = \frac{p}{R \, T} = \frac{14.61 \times 144.0 }{1716.49 \times 530.77} = 0.002309~\mbox{slugs ft${^{-3}}$} \]](https://eaglepubs.erau.edu/app/uploads/quicklatex/quicklatex.com-b687e2ab921d399ed8a7f3311e9ed6ea_l3.svg "Rendered by QuickLaTeX.com")
Bulk Modulus
The bulk modulus, denoted by the symbol  , measures a substance’s resistance to uniform compression, such as under pressure or some external body force per unit mass. The bulk modulus is equivalent to a compressive “stiffness” and is an essential property in fluid mechanics. In particular, its value is related to the speed of sound propagation in liquids, which plays a fundamental role in various scientific, industrial, and medical imaging[9], and other technological applications[10], where precise measurement and understanding of acoustic properties are crucial.
When a fluid of original volume is subjected to a change in external pressure  , it undergoes a volume change
  , the relationship being given by
(28) 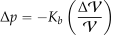
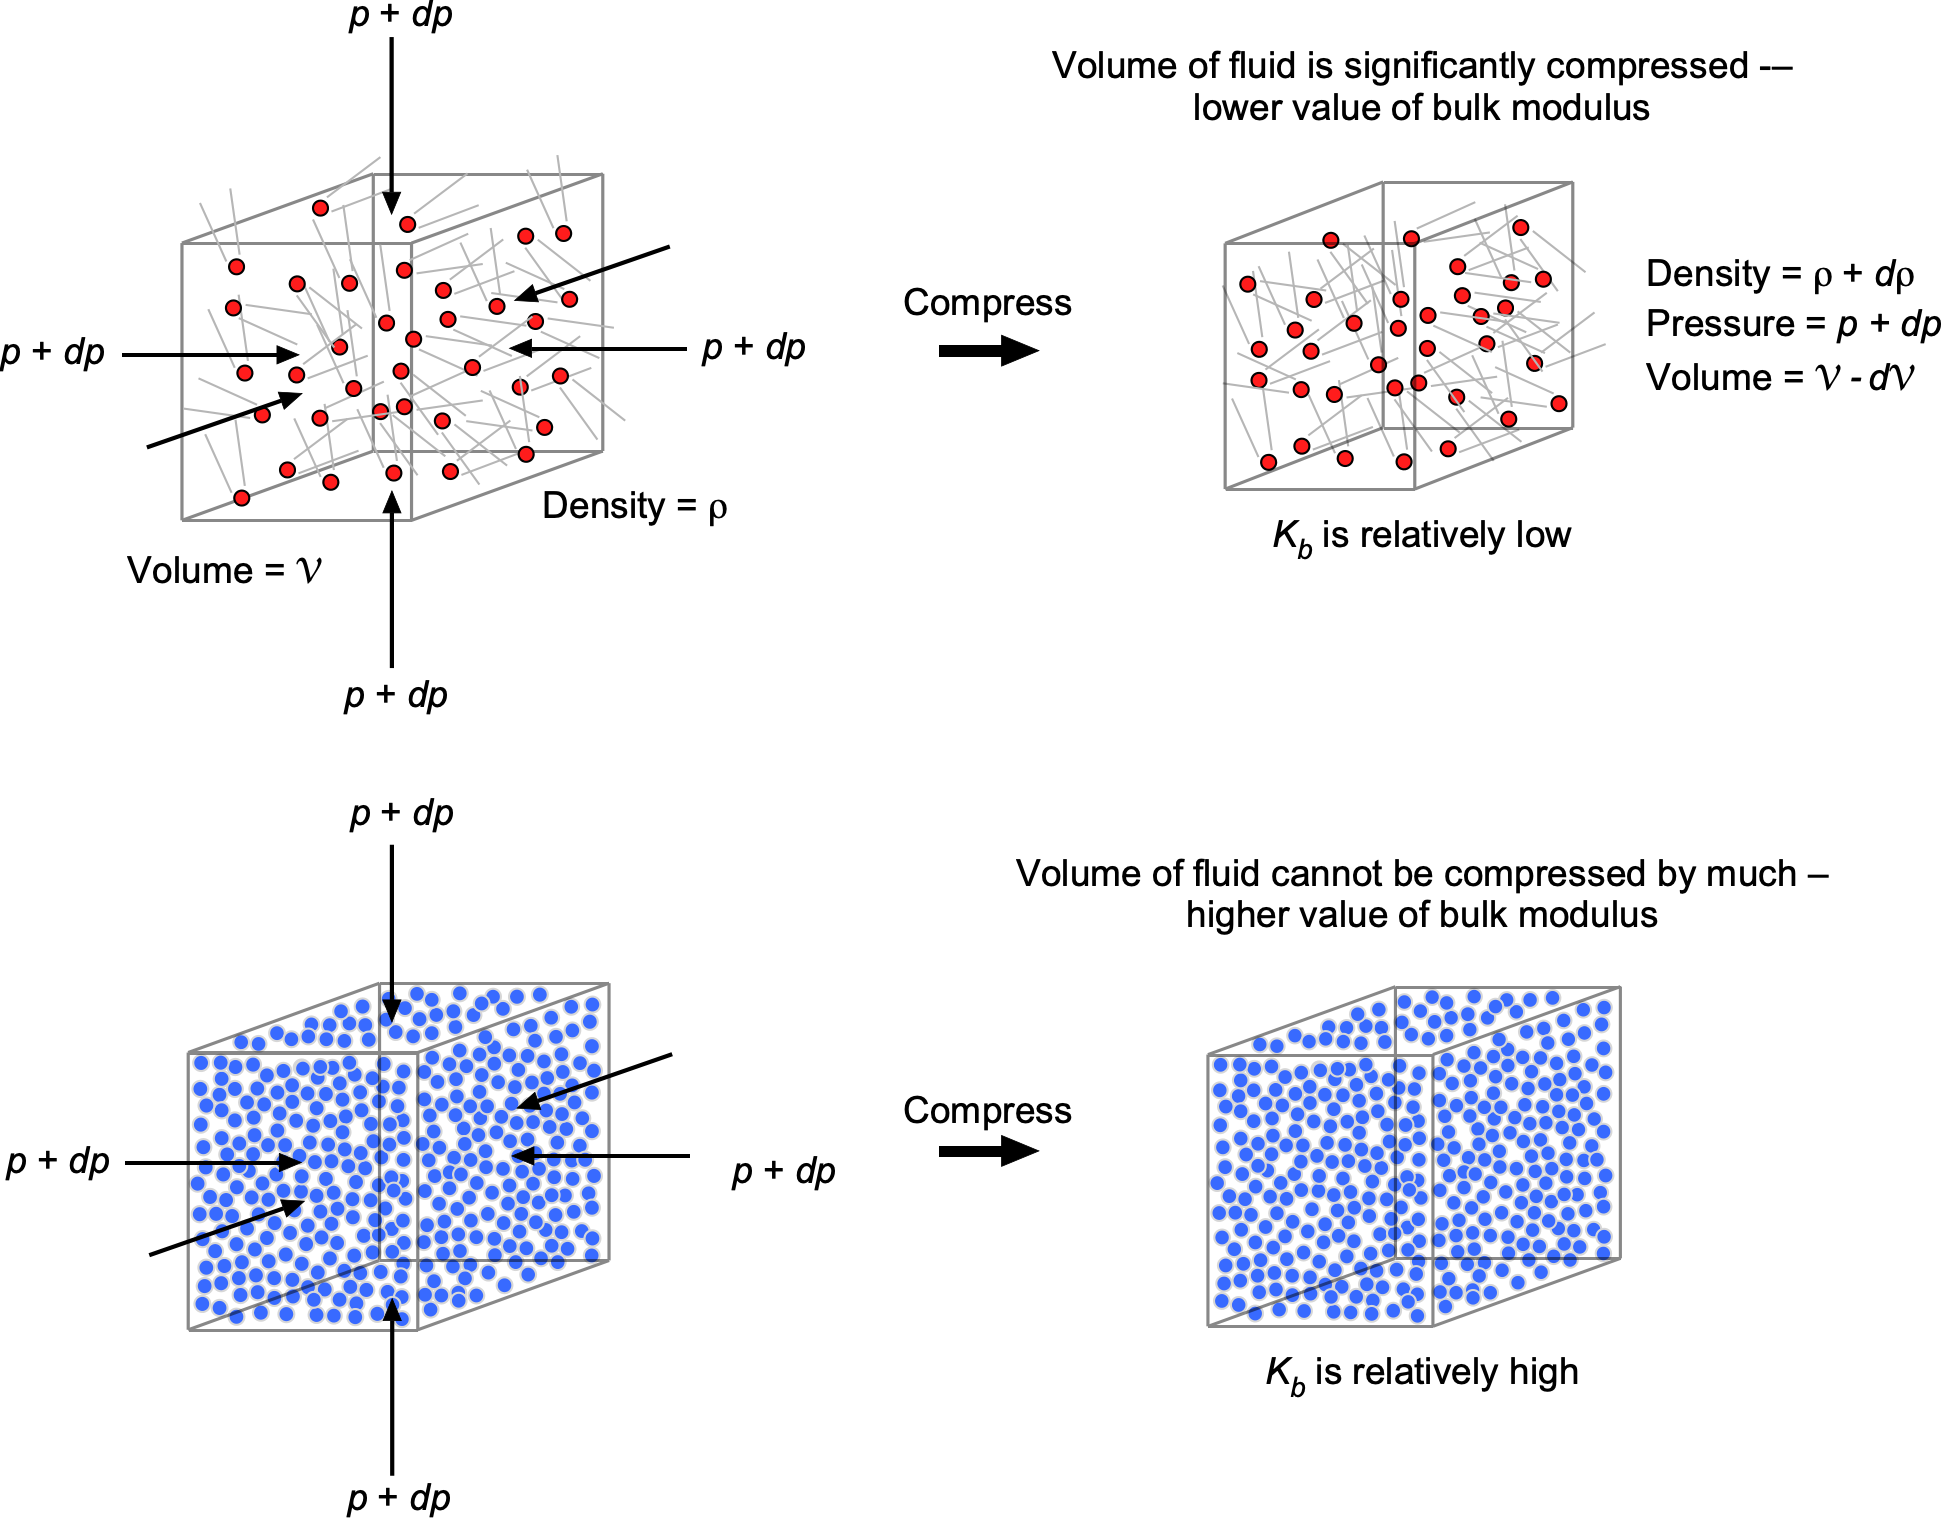
where the coefficient is called the bulk modulus. Notice that the minus sign means a positive change in applied pressure will decrease the fluid volume, as illustrated in the figure below. In the limit when the change in pressure becomes infinitesimally small, then Eq. 28 becomes
(29) 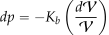
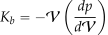
Therefore, the bulk modulus is defined as
(30) 
Conservation of mass of the fluid volume also requires that
(31) 
Expanding out and simplifying gives
(32) 
or
(33) 
Therefore, the bulk modulus can also be defined as
(34) 
In other words, Eqs. 30 and 34 quantify the degree of compressibility of the original volume of fluid under pressure. A high bulk modulus value indicates that the substance is difficult to compress, i.e., it is essentially incompressible. It will also be apparent that the bulk modulus has units of pressure.
Liquids have relatively high values of bulk modulus because their molecules are closely packed together, resisting pressure and other external forces that can cause compression. Indeed, for all practical purposes, liquids cannot be compressed significantly (their values of bulk moduli are in the GPa or Giga-Pascal range), so, with few exceptions, they can be considered incompressible fluids.
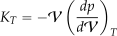
Gases have much lower values of bulk modulus because their molecules are farther apart, with larger spaces between them, allowing them to be compressed more easily. In general, gases cannot be considered incompressible fluids, and the bulk modulus of a gas varies with its pressure and temperature. One type of bulk modulus used in practice is the isothermal (i.e., constant temperature system) bulk modulus,  , which can be written as
(35) 
The isothermal gas law (Boyle’s law) states that  constant, so differentiating with respect to using the product rule gives
(36) 
so that
(37) 
Substituting this result into Eq. 35 gives
(38) 
This means that a gas’s isothermal bulk modulus is its pressure; therefore, its “stiffness” or resistance to compression is directly proportional to its pressure. As the gas’s pressure increases, its resistance to further compression rises proportionally.
If the compression is adiabatic, the gas’s temperature increases because the work done on it increases its internal energy. Conversely, the temperature decreases during adiabatic expansion as the gas exchanges energy with its surroundings, losing internal energy. In an adiabatic process, the relationship between pressure and density is
(39) 
Differentiating this equation with respect to using the product rule leads to
(40) 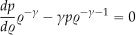
and solving for  gives
gives
(41) 
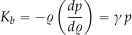
Therefore, substituting this previous result into Eq. 34 for an adiabatic process, gives the bulk modulus as
(42) 
Fluid Viscosity
The property of viscosity can be viewed as the fluid’s resistance to shear when different parts of the fluid are in relative motion, i.e., its “internal friction” or resistance to being deformed. Viscosity can also be viewed as a measure of fluidity, i.e., the higher the viscosity, the lower the fluidity. The symbol  (i.e., the Greek symbol “mu”) is a constant known as the coefficient of dynamic viscosity, or more simply, just the fluid’s viscosity.
All fluids have viscosity to a lesser or greater degree, so for a fluid in relative motion, the property of viscosity causes shear forces to be produced within the fluid. Gases generally have a much lower viscosity than liquids, which is a reasonably obvious expectation. Some liquids are very viscous, such as molasses, corn syrup, grease, and heavy oils. However, the effects of viscosity come into play in the behavior of all types of fluids.
Viscometer
One way to begin understanding the property of viscosity is to consider a demonstration with three columns of oil, as shown in the figure below. Each oil has a different viscosity, ranging from SAE 20 (the thinnest and least viscous) to SAE 40 (the most viscous). SAE stands for the Society of Automotive Engineers. Suppose a heavy steel ball is dropped into the oil. In that case, it will descend at a velocity proportional to its viscosity, as the oil causes shear stresses on the ball’s surface, resulting in a viscous drag as it moves downward under the influence of gravity.
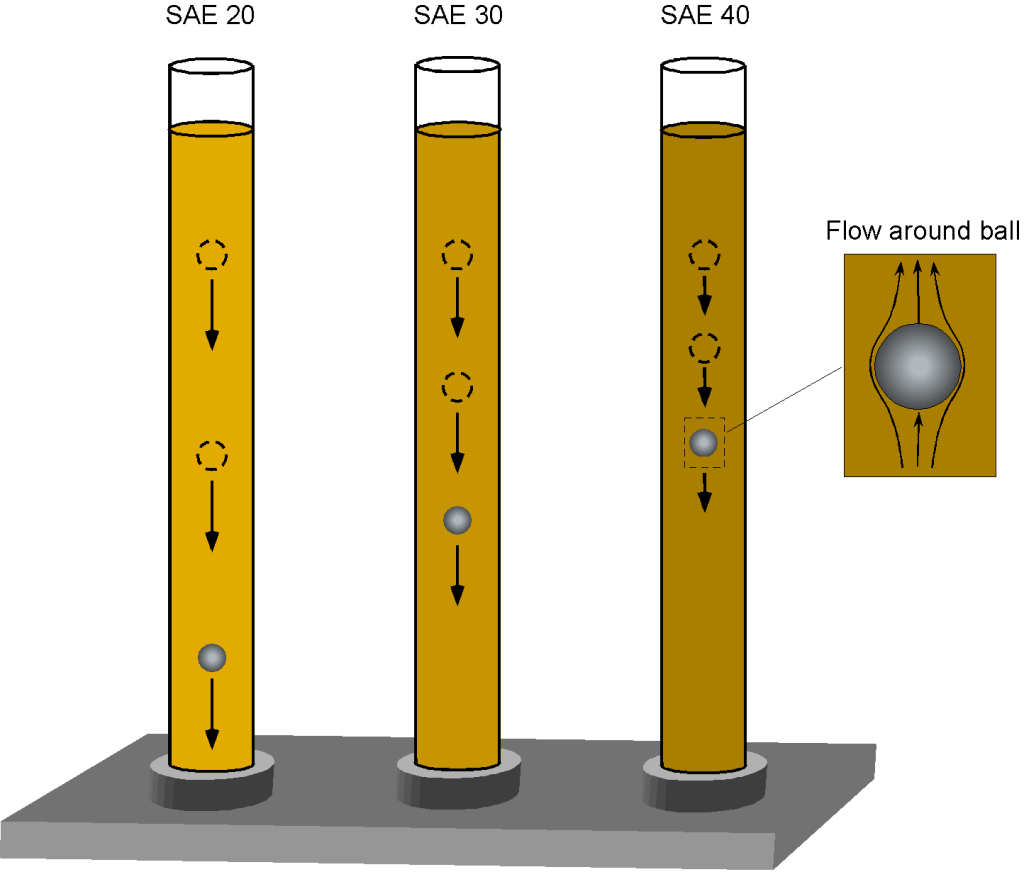
The balance of forces in equilibrium descent is such that the weight of the ball,  , less any buoyancy force,
  , is equal to the viscous drag on the ball,
  . The weight will be density times volume times acceleration under gravity, i.e.,
(43) 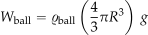
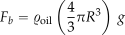
where  is the density of the steel ball. The (upward) buoyancy force on the ball (Archimedes’ principle) will be equal to the weight of oil displaced by the ball, i.e.,
(44) 
Therefore, the equilibrium equation is
(45) 
The drag force on a sphere of radius dropping through a fluid of high viscosity at low speed  (this is called a creeping flow) is given by Stokes’s law, i.e.,
(46) 
where is the viscosity of the fluid. Therefore, in equilibrium, then
(47) 
and rearranging to solve for gives
(48) 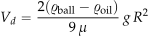
For a ball of the same weight and size, Eq. 48 shows it will drop in the oil at a velocity that is inversely proportional to the oil’s viscosity, , i.e., the higher the viscosity, the slower the ball drops. The foregoing is the principle used in the falling-sphere viscometer. The time,  , it takes for a steel sphere of known size (radius), , and weight (material density ), can be measured using two lines on the tube a distance
  apart, from which the ball’s velocity, , is determined. Stokes’s law (Eq. 46) can be used to determine the viscosity, , of the oil (or other liquid) from the resulting velocity by knowing the size and weight of the sphere as well as the density of the liquid, i.e.,
(49) 
How does one measure the viscosity of a gas?
Gases have significantly lower viscosities than liquids. One way to measure a gas’s viscosity is by using a capillary viscometer, a method first used by William Rankine. This technique measures the pressure drop along the length of a narrow capillary tube. A capillary tube is used to ensure the flow is laminar, for which there is an exact theoretical solution for the pressure drop, known as Poiseuille’s law, which is written in terms of the coefficient of dynamic viscosity. Temperature control of the gas flow is significant, but capillary viscometers can provide acceptable viscosity measurements.
Units of Viscosity
Viscosity has units of kg m-1 s-1 or Nm-2s or Pa s (i.e., a Pascal-second often called the Poiseuille, named after Jean Léonard Marie Poiseuille) in the SI system or slug ft-1 s-1 in the USC system. However, the unit of viscosity typically employed in practice is called the “Poise” (P) or gram cm-1 s-1. The unit of poise is 1 Poise = 0.1 Pa s = 1 Poiseuille, i.e., 1 Pa s = 10 Poise. The viscosity of liquids is usually a low numerical value, so it is often reported in units of centipoise (cP). In contrast, the viscosity of gases, which are much less viscous than liquids, is usually reported in units of micropoise (μP). In base units, at MSL ISA then  = 1.789 x 10⁻⁵ kg m-1 s-1 = 1.789 x 10⁻⁵ Pa s = 3.737 x 10⁻⁷ slug ft-1 s-1.
Shear in a Fluid
In Newton’s Philosophiæ Naturalis Principia Mathematica of 1687, he uses the Latin word tenacitas to mean viscosity. He then defines the concept of viscosity as “Resistentia, quae oritur ex inopia lubricitatis partium fluidi, caeteris paribus, proportionalis est velocitati, qua partes fluidi separantur ab invicem,” which can be translated as “The resistance which arises from the lack of slipperiness originating in a fluid, all other things being equal, is proportional to the velocity by which the parts of the fluid are being separated from each other.”
Newton performed experiments similar to the one shown in the figure below, using a fluid of depth  between a moving upper plate and a stationary lower plate, i.e., a flow containing a velocity gradient in one direction, with the velocity in the fluid increasing as it moves from one point to another. The upper (faster) layer draws the lower (slower) layer along through a force on the lower layer, so there must be a shear force in the fluid between the layers. Simultaneously, the lower layer tends to exert an equal and opposite force on the upper layer (i.e., Newton’s Third Law).
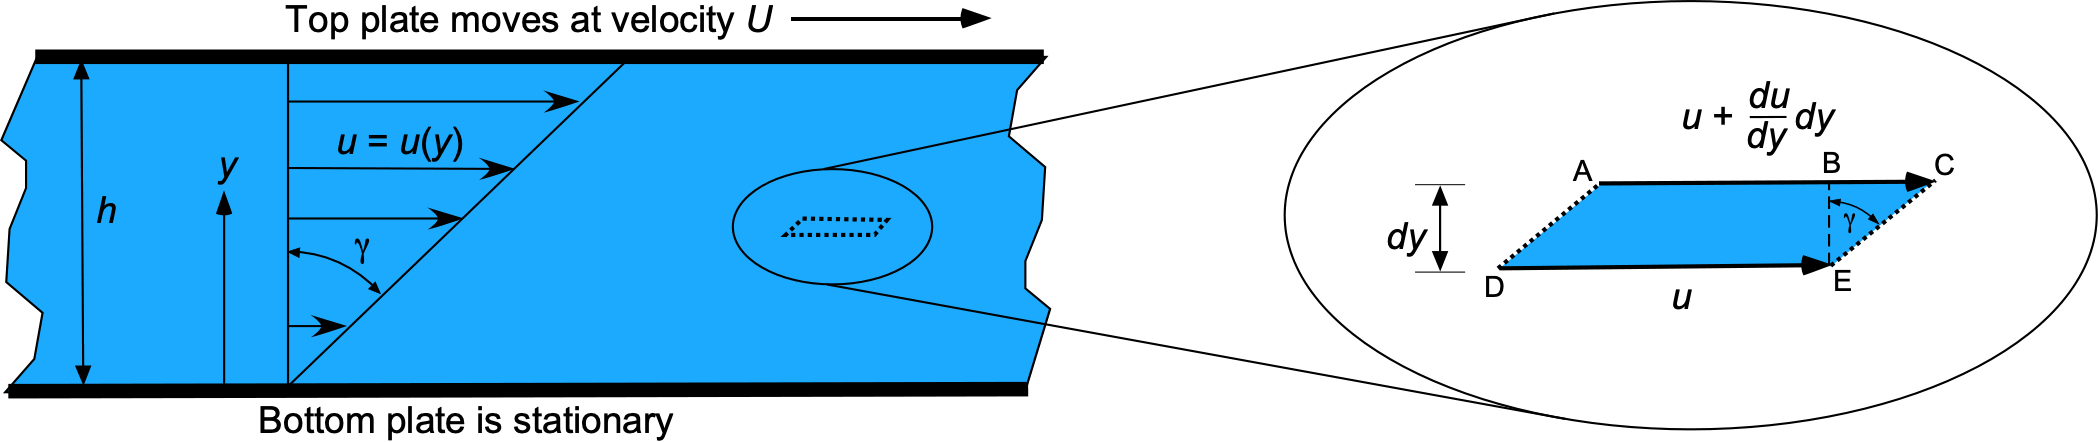
The fluid next to the bottom plate wants to remain at rest, and the fluid touching the top plate is dragged along (because of viscosity) with a velocity  . Consequently, a velocity gradient forms in the fluid between the two plates. Maintaining this gradient requires the application of a force, , where
(50) 
where is the area of the plate. Notice that the ratio  is the slope of the velocity profile or the velocity gradient. In terms of force per unit area, which is a stress,
  , then
(51) 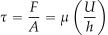
where the constant of proportionality, , is the “resistance to shear,” i.e., the fluid’s viscosity.
In general, for the straight and parallel motion of a given fluid, the tangential stress produced between two adjacent fluid layers is proportional to the velocity gradient in a direction perpendicular to the layers, i.e.,
(52) 
where  is the velocity at some distance
  . The quantity
  is the velocity gradient in the direction. The velocity gradient is equivalent to a strain rate, so this preceding equation is just a statement of a fluid’s linear stress/strain rate relationship. Equation 52 is called Newton’s law of viscosity. Remember that maintaining a velocity gradient and the shear stresses in a fluid requires continuous application of a force; if the force were to stop, the fluid would stop deforming, and the shear stresses would become zero.
To explain this latter point further, consider a fluid element as it flows in a fluid with a velocity gradient, as shown in the right-side figure above. If is positive, then the upper surface of the element will move faster than the lower surface, so over some time  , the upper AC surface will travel further than the lower surface DE by a distance
(53) 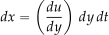
Consequently, a shear deformation or strain is produced in the fluid. This strain can be calculated from the geometry of the deformation shown in the figure above. The strain,  , which is the angle between the lines EB and EC, is
(54) 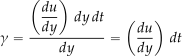
to a small-angle approximation. Rearranging the equation gives
(55) 
and so the shear stress in the fluid is
(56) 
This latter result is another way of writing Newton’s law of viscosity. Notice that the shear stress depends on the strain rate, i.e.,  . Remember that the shear stress in a solid is proportional to strain, so a constantly applied strain will create constant deformation and stress. In a fluid, however, shear stress is only produced by a strain rate because the fluid continuously flows and deforms.
Velocity Gradients & Shear Stresses
Newton’s law of viscosity should be written more precisely using the partial derivative on the velocity gradient, i.e., it should be written as
(57) 
because the velocity in a fluid may vary in other directions as well, e.g., the flow is three-dimensional, so there could be velocity gradients in the  and
and  directions, i.e.,
  , and
, and  . In general, these gradients can be written in the matrix (or tensor) form as
(58) ![\begin{equation*} \frac{\partial u^i}{\partial x^j} = \left[ \begin{array}{ccc} \displaystyle{ \frac{\partial u}{\partial x}} & \displaystyle{ \frac{\partial u}{\partial y} } & \displaystyle{ \frac{\partial u}{\partial z} } \\[12pt] \displaystyle{ \frac{\partial v}{\partial x} } & \displaystyle{ \frac{\partial v}{\partial y} } & \displaystyle{ \frac{\partial v}{\partial z} } \\[12pt] \displaystyle{ \frac{\partial w}{\partial x} } & \displaystyle{ \frac{\partial w}{\partial y} } & \displaystyle{ \frac{\partial w}{\partial z} } \end{array} \right] \end{equation*}](https://eaglepubs.erau.edu/app/uploads/quicklatex/quicklatex.com-e80447c3bf163250da6e0bcdbcda491d_l3.svg "Rendered by QuickLaTeX.com")
The velocity gradient tensor is diagonally symmetric, meaning that the cross-derivatives are related, i.e.,  ,
,  , and
, and  . This symmetry reduces the number of unique velocity gradients from nine to six, so the shear stress tensor becomes
(59) 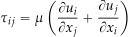
and in component form, then
(60) ![\begin{equation*} \tau_{ij} = \left[ \begin{array}{ccc} \displaystyle{ 2 \mu \frac{\partial u}{\partial x}} & \displaystyle{ \mu \left( \frac{\partial u}{\partial y} + \frac{\partial v}{\partial x} \right)} & \displaystyle{ \mu \left( \frac{\partial u}{\partial z} + \frac{\partial w}{\partial x} \right)} \\[12pt] \displaystyle{ \mu \left( \frac{\partial u}{\partial y} + \frac{\partial v}{\partial x} \right)} & \displaystyle{ 2 \mu \frac{\partial v}{\partial y}} & \displaystyle{ \mu \left( \frac{\partial v}{\partial z} + \frac{\partial w}{\partial y} \right)} \\[12pt] \displaystyle{ \mu \left( \frac{\partial u}{\partial z} + \frac{\partial w}{\partial x} \right)} & \displaystyle{ \mu \left( \frac{\partial v}{\partial z} + \frac{\partial w}{\partial y} \right)} & \displaystyle{ 2 \mu \frac{\partial w}{\partial z}} \end{array} \right] \end{equation*}](https://eaglepubs.erau.edu/app/uploads/quicklatex/quicklatex.com-8490d04eea35ec0d8f8f7e6629fb9ea7_l3.svg "Rendered by QuickLaTeX.com")
This is a significant result used to derive the momentum equation for a fluid, the Navier-Stokes equation. Notice that the diagonal terms in the stress tensor are called normal compressive stresses because they act perpendicular (or normally) to the respective surfaces. The off-diagonal terms are shear stresses, which act tangentially to the surfaces.
What is kinematic viscosity?
Dynamic viscosity is a measure of shear resistance, i.e., viscosity only matters in the presence of motion or dynamics. In many fluid problems involving viscosity, the magnitude of the viscous forces compared to the magnitude of the inertia forces is critically important; that is, the forces causing an acceleration of the fluid. Because the viscous forces are proportional to and the inertia forces are proportional to , the ratio of  is often involved in solving the problem. This ratio of to density is called the kinematic viscosity and given the symbol
  (Greek symbol “nu”), i.e.,
![\[ \nu = \frac{\mu}{\varrho} \]](https://eaglepubs.erau.edu/app/uploads/quicklatex/quicklatex.com-cb039e1fb38d5d0140c8292e53ecaef1_l3.svg "Rendered by QuickLaTeX.com")
Therefore, kinematic viscosity is a derived parameter. Kinematic viscosity values have units of ms in the SI system or fts in the USC system.
Mechanisms of Viscosity
The viscous properties of a fluid arise from two sources: 1. Intermolecular momentum transfer between the molecules, and 2. Bonding between the molecules. Therefore, the viscosity of a fluid depends on whether it is a gas or a liquid; its characteristics primarily depend on the physics associated with the mean relative spacing between its molecules.
The molecules in a liquid are relatively close together, but they are not as mobile as those in a gas. In this case, viscosity results more from molecular bonding and less from intermolecular momentum transfer. As shown in the schematic below, stronger bonding results in higher resistance to deformation, i.e., higher viscosity. In general, intermolecular bonding can be influenced by factors such as the size, molecular weight, strength of the bonds, and temperature of the liquid.
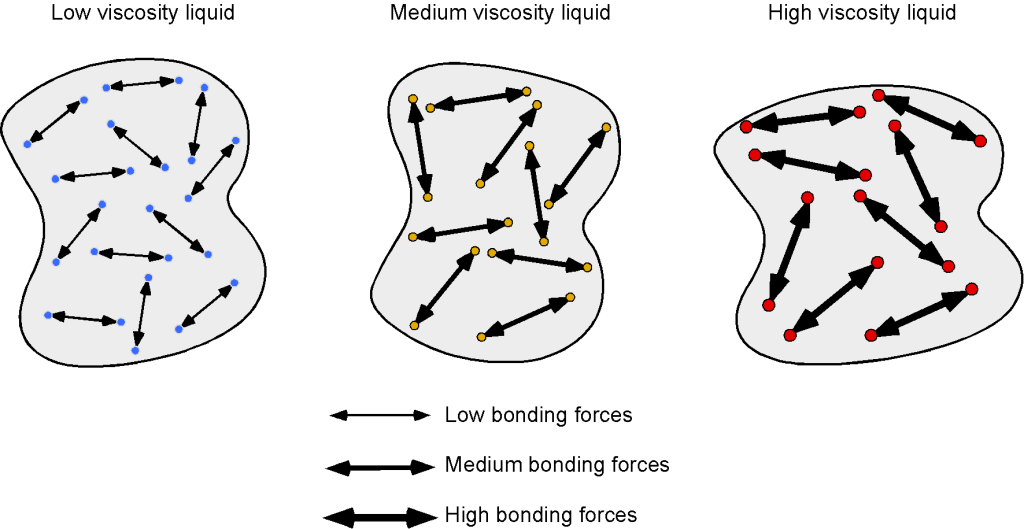
For example, liquids with large, heavy molecules tend to have a higher viscosity than liquids with small, light molecules because the larger molecules have more intermolecular bonds and are more resistant to flow. Liquids such as benzene, diethyl ether, gasoline, ethanol, and water flow very readily because of their low viscosity. Others, such as honey, heavy oils, glycerin, motor oil, molasses, and maple syrup, flow very slowly and have a high viscosity. There is also a correlation between viscosity and molecular shape. Liquids of long, flexible molecules tend to have higher viscosities than those of more spherical or shorter-chain molecules. The longer the molecules, the easier it is for them to become “tangled” with one another, increasing the viscosity of the liquid.
The intermolecular bonding is much lower because the molecules in a gas are farther apart. The mechanism of viscosity results from intermolecular momentum transfer as the fairly mobile molecules diffuse throughout the gas. Nevertheless, gases are still viscous and exhibit the characteristics of viscosity. This effect becomes more apparent when the gas has an initial velocity gradient, as shown in the schematic below.
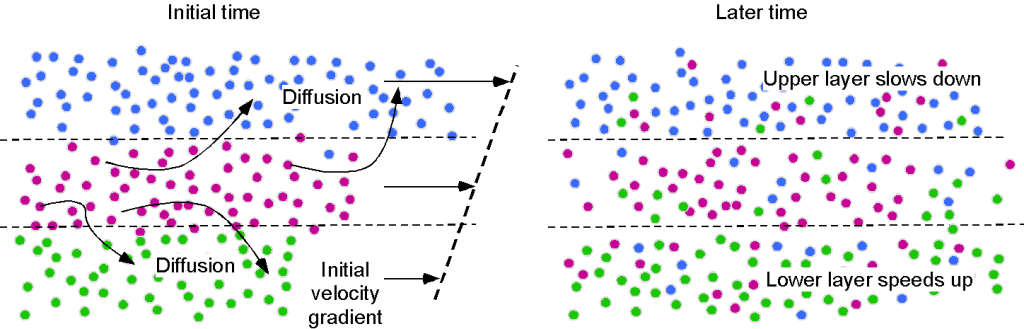
The random motion of gas molecules between fluid layers means that collisions inevitably occur, and momentum is exchanged, whereby slower molecules gain momentum from the faster molecules. The consequence of intermolecular momentum transfer is a shear force between the gas layers in regions of velocity gradient, resulting in resistance to further deformation, which manifests as viscosity. Remember that fluids must be continuously deformed to produce stresses, so in the absence of any additional shear rates, the velocity gradients will diminish as the momentum interchange balances throughout the layers of the gas.
Newtonian Versus Non-Newtonian Fluids
A Newtonian fluid is a fluid in which the value of is constant and independent of the strain rate (i.e., is independent of the magnitude of the velocity gradient). Many fluids, including air and water, behave as Newtonian fluids, i.e., they obey a linear stress-strain relationship, as shown in the figure below. Therefore, the value of can be assumed to be constant. Remember that in a fluid, the shear stresses produced by viscosity are directly related to the strain rate generated in the fluid by its deformation.
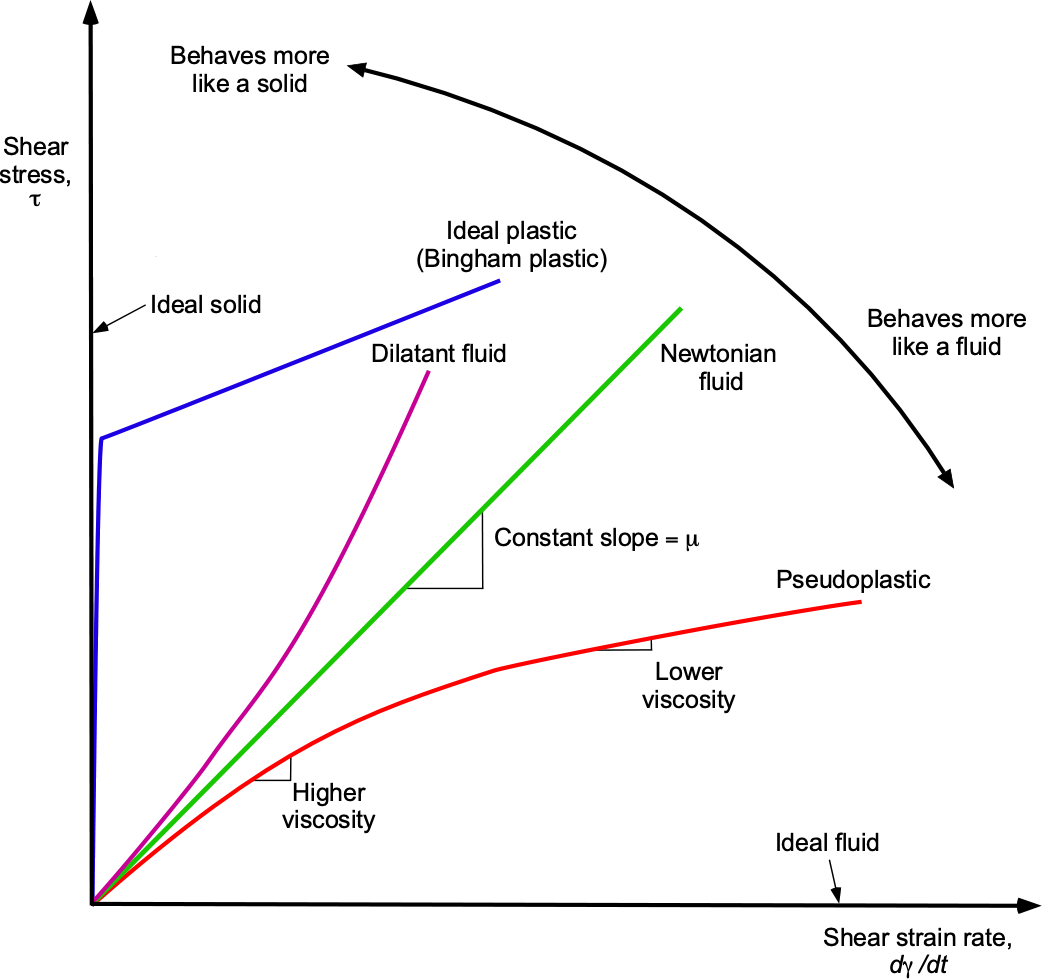
However, not all fluids behave in this linear way. For example, fluids such as certain oils, blood, inks, and most paints exhibit non-Newtonian behavior, where their viscosity changes as a function of the strain rate. The viscosity may increase or decrease with an increasing strain rate, depending on the nature of the fluid. For example, a dilatant fluid experiences shear thickening, and a pseudoplastic fluid exhibits shear thinning. The behavior of such non-Newtonian fluids is less well understood, making their behavior less predictable; however, they have numerous practical applications. For example, paints behave as pseudoplastic fluids, which thin when mixed or agitated during brushing or spraying. After application, the paint thickens, preventing it from running off the surface. The study of non-Newtonian fluids is called rheology. Conventional methods cannot be used to measure the viscosity of a non-Newtonian fluid. Instead, it is necessary to measure the apparent viscosity, which considers the shear rate at which the viscosity measurement was made.
Why is ketchup so hard to get out of the bottle?
Ketchup is infamous for being difficult to remove from a bottle unless you know the secret. Shake it first! In the bottle, ketchup is a reasonably viscous fluid and does not pour easily because of the relatively strong cohesive bonding between the ketchup molecules, which includes various polymer chains. To liquefy ketchup, vigorously shake the bottle, which agitates and deforms the fluid, creating a strain rate. This process also stretches the polymer molecules, allowing them to experience less cohesive bonding and, consequently, reduced viscosity. The process takes a few seconds, but you can easily pour the ketchup onto your burger. Today, ketchup often comes in squeeze bottles, in which the ketchup is forced through an orifice by creating pressure in the bottle. This process also creates a strain rate, which reduces the viscosity of the ketchup, allowing it to be poured. After this point, the ketchup thickens again, so it doesn’t run off your burger!
Effects of Temperature on Viscosity
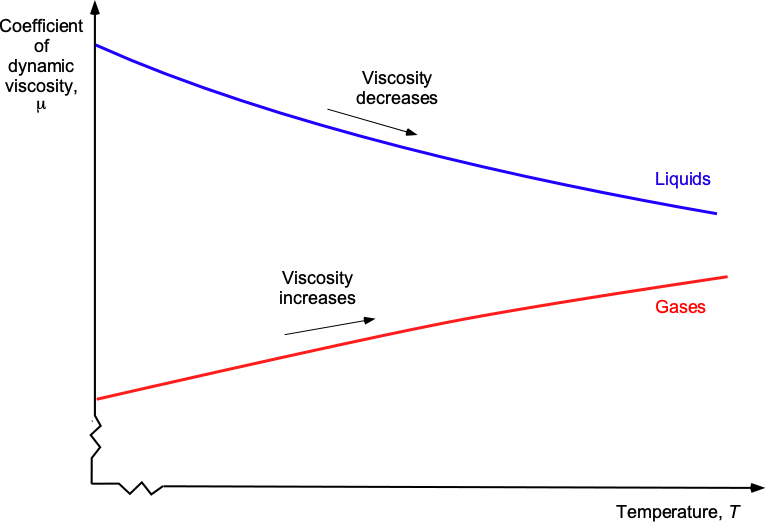
Temperature has a significant impact on the viscosity of both gases and liquids. Consequently, the viscous characteristics of gases change differently from liquids when subjected to changes in temperature, as shown in the figure below. For example, the viscosity of a liquid generally decreases with increasing temperature. This effect occurs because the reduction in bonding forces, as the motion of the molecules causes them to move further apart, dominates over any increase in intermolecular momentum transfer. Consequently, liquids become less viscous and flow more easily as the temperature increases. However, gases, including air, typically exhibit increased viscosity with increasing temperature because of the increase in intermolecular momentum transfer, which increases the resistance to the fluid’s deformation.
Sutherland’s Law of Viscosity for Gases
The coefficient of dynamic viscosity, (or often referred to as the coefficient of viscosity or viscosity), for a gas can be calculated using Sutherland’s formula or Sutherland’s law. This empirical (i.e., experimentally derived) law was first published in 1893 and can be written as a function of absolute temperature, , as
(61) 
where reference values (subscript “ref”) are in appropriate SI or USC units. The parameter  is known as Sutherland’s constant. A graphical interpretation of Sutherland’s law is shown in the figure below.
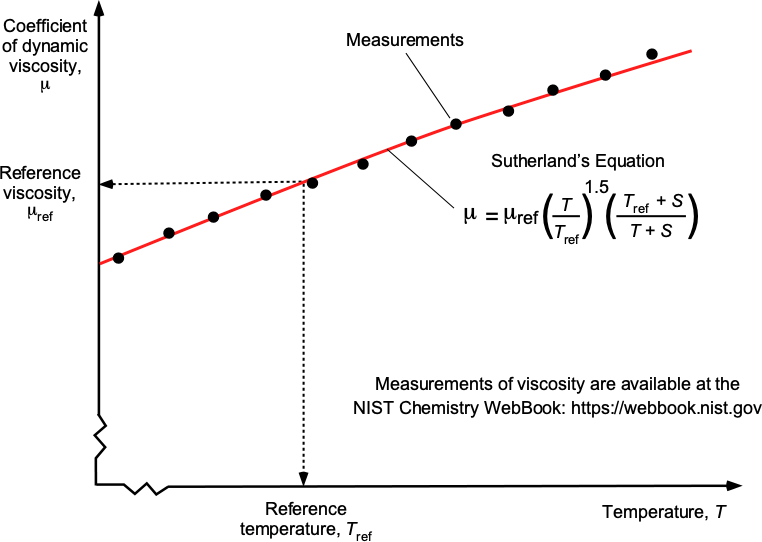
For air in SI units, then  = 323 K are
  kg m s (also known as units of Pa~s), with a Sutherland constant of = 110.0 K. In USC units at = 518.67 R, then = 198.72 R and
  slugs s ft. Coefficients for other gases are widely available in reference books and online data sources.
Sutherland’s law is widely used in various engineering fields to predict the viscosity of gases at different temperatures. It operates over a wide range of temperatures for air and gases, including oxygen, nitrogen, and helium. However, it is essential to note that it is not universally applicable to all gases. For example, Sutherland’s law does not apply to gases that exhibit significant deviations from ideal behavior, such as rarefied gases or gases containing large molecules. Additionally, Sutherland’s law does not apply to liquids, which exhibit a more complex relationship between viscosity and temperature because of the effects of intermolecular bonding. In general, Sutherland’s law should be used cautiously, and its applicability should be verified for each specific gas and temperature range of interest.
Check Your Understanding #3 – Calculating the value of viscosity
If a measurement in air gives a temperature of 52F, calculate the dynamic viscosity coefficient. Hint: Use Sutherland’s Law. What happens to the viscosity of air as its temperature increases, and why?
Show solution/hide solution.
Sutherland’s Law can be expressed as
![\[ \mu (T) = \mu_{\rm ref} \left( \frac{T}{T_{\rm ref}} \right)^{1.5} \left( \frac{T_{\rm ref} + S}{T+S} \right) \]](https://eaglepubs.erau.edu/app/uploads/quicklatex/quicklatex.com-b7140e3fad32ec1247f2669fd79dcaa5_l3.svg "Rendered by QuickLaTeX.com")
where  R,
R,  R and slugs s ft. In this case, the absolute temperature is
![\[ 52 \ ^{\circ}\mbox{F} \equiv 511.67 \ ^{\circ}\mbox{R} \]](https://eaglepubs.erau.edu/app/uploads/quicklatex/quicklatex.com-ed54563d164cda07980bb4967bc1319c_l3.svg "Rendered by QuickLaTeX.com")
Inserting the values gives
![\[ \mu = 3.737 \times 10^{-7} \left( \frac{511.67}{518.67} \right)^{1.5} \left( \frac{518.67 + 198.72}{511.67 + 198.72} \right) \]](https://eaglepubs.erau.edu/app/uploads/quicklatex/quicklatex.com-1749d1e74f6550754fefadb1e0a3087c_l3.svg "Rendered by QuickLaTeX.com")
Therefore,
![\[ \mu = 3.696\times 10^{-7}~\mbox{ slugs s$^{-1}$ ft$^{-1}$} \]](https://eaglepubs.erau.edu/app/uploads/quicklatex/quicklatex.com-fd2ff0cf9c3895704b9527404319db31_l3.svg "Rendered by QuickLaTeX.com")
Bonding between molecules in a gas is relatively low compared to that in a liquid. Therefore, the intermolecular momentum transfer between the molecules increases more with increasing temperature, which manifests as an increase in viscosity.
No, a shock wave in air does not cause air to become a non-Newtonian fluid. Air remains a Newtonian fluid even under the relatively extreme conditions of shock wave formation. As we discussed in class, a Newtonian fluid is defined by its linear relationship between shear stress and shear rate, which means its viscosity remains constant regardless of the applied stress. In contrast, non-Newtonian fluids have a non-linear relationship, meaning their viscosity can change with the applied stress. A shock wave in air causes a sudden and significant pressure, temperature, and density increase. Basically, the air is squeezed into a narrow wavefront. However, the molecular structure and the basic properties of air remain the same, and the air continues to behave as a Newtonian fluid. The viscosity of air may change with temperature, which can be quantified using Sutherland’s law, but this change is consistent with the behavior of a Newtonian fluid.
Temperature Effects on the Viscosity of Liquids
The Andrade equation, named after British physicist Edward Andrade, is a commonly used semi-empirical model to predict the effects of temperature on the viscosity of liquids. This equation relates the viscosity of a liquid to temperature based on an exponential relationship, i.e.,
(62) 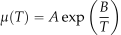
where is the viscosity of the liquid and is the absolute temperature, and the coefficients and  depend on the liquid. Values of and for this two parameter model are widely published for many liquids. This equation represents the behavior that viscosity decreases with increasing temperature for a liquid.
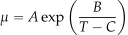
There are also other semi-empirical models for the effects of temperature on the viscosity of liquids. The three-parameter model is
(63) 
and the four-parameter model is
(64) 
Again, the coefficients, A, B, C, and D for most liquids can be found in published sources.
What does it mean when my car needs to use 20W50 engine oil?
Engine oils are classified by their viscosity grades, designated by numbers such as SAE 5 to SAE 50 or higher; the higher the number, the higher the viscosity (thicker oil). Using a single-grade oil, such as SAE 50, can lead to problems in extreme temperature conditions. The oil must maintain adequate viscosity at high temperatures to provide sufficient lubrication and prevent engine wear. However, a highly viscous oil like SAE 50 can become too thick at low temperatures and may not properly lubricate the engine components. To address these temperature-related issues, most modern oils are formulated as multigrade oils denoted by a combination of two numbers, such as SAE 20W50. The “W” represents winter and indicates the oil’s viscosity at low temperatures. The oil has an SAE 20 oil viscosity at lower temperatures, providing better initial lubrication of the engine parts. At higher temperatures, it maintains the viscosity of an SAE 50 oil to offer adequate lubrication. This characteristic involves blending additives into the base oil that modify the intermolecular interactions and control its temperature-dependent viscosity.
Flow Velocity
In fluid mechanics, a primary focus is on fluids in motion, called fluid dynamics. Hence, the velocity of the fluid is a significant quantity that must be defined carefully. By definition, a velocity is a vector quantity, so the velocity of any given fluid packet will have both a magnitude (a speed) and a direction. When the concept of the velocity of a fluid is considered, which will have relative motion between the fluid packets, then its velocity becomes more subtle to describe than for a solid body where all the parts will move in unison.
For example, for a solid body in translational motion, it is evident that all points of the body will be traveling at the same velocity, i.e., with the same speed and direction. However, different parts of a fluid in motion will most likely travel at varying velocities so that they will be in relative motion. This is just one reason why the motion of fluids is somewhat more challenging to describe, both physically and mathematically.
Tracking where the fluid moves in space and time is essential to understanding flow problems, allowing one to visualize where the flow goes as it passes around an airfoil or other object. Consider the flow about an airfoil at a steady angle of attack and follow the path of a small group of fluid particles initially upstream of the airfoil at point 1, as shown in the figure below. This group is called a fluid element because it is a small elemental flow volume. The speed and direction of the fluid elements will change as they move downstream from point 1 to points 2 and 3, point 3 being nearer to the nose of the airfoil. Point 3 at the nose is called a stagnation point because the air is brought to rest there and stagnates. Therefore, the flow velocity at 1 or 2 or 3, or any other point in the field, is just the velocity of an infinitesimally small fluid element as it passes through that point. The flow passes around the airfoil and leaves it at point 4. In this case, the paths that the fluid elements follow are also called streamlines, although the distinction between streamlines, pathlines, and streakliness is still to be made.
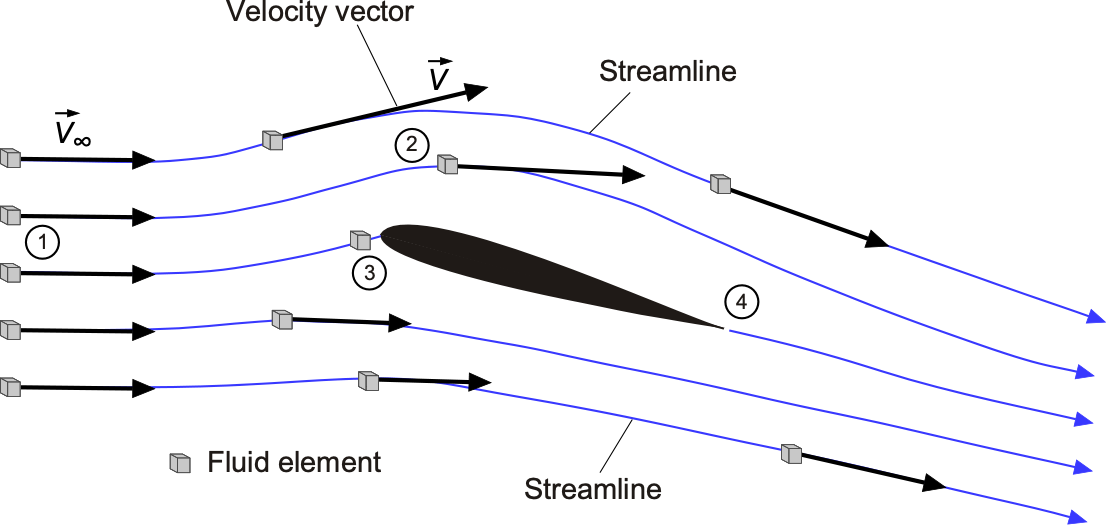
Velocity has magnitude and direction, but it is still a point property in that its value will change from point to point in the flow, and it can also change with respect to time, i.e.,  . Flow velocities are measured in units of m s in the SI system or ft s in the USC system.
Equation of a Streamline
The equation of a streamline is straightforward to determine. For a two-dimensional flow in the – plane, then  so the slope of a streamline is just
  , which is an ordinary differential equation. Therefore, this differential equation could be solved with the known velocity field to trace a streamline in a given plane. In three-dimensions, i.e., in , and space then
  . In this case, a direction vector, say
  , can be defined that points along the streamline, i.e., in a direction parallel to the streamline, as shown in the figure below.
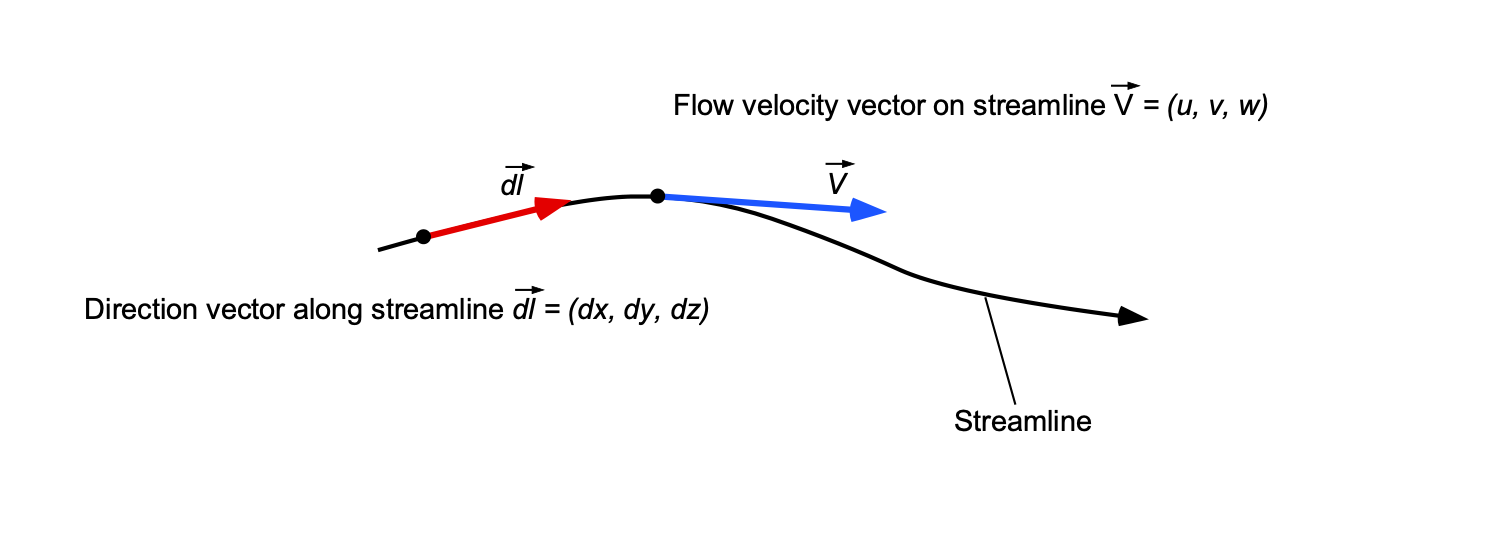
By definition, there is no flow across a streamline, so the equation of a streamline in three-dimensional space is just
(65) 
noting that  is the zero vector.
The meaning of this latter equation becomes clearer by expanding out the vector equation in terms of its scalar components, i.e.,
(66) ![\begin{equation*} d\vec{l} \times \vec{V} = \left| \begin{array}{ccc} \, \vec{i} &\, \vec{j} & \, \vec{k} \\[6pt] \displaystyle{\frac{\partial}{\partial x}} & \displaystyle{\frac{\partial}{\partial y}} & \displaystyle{\frac{\partial}{\partial z}} \\[10pt] u & v & w \end{array} \right| = (w \, dy - v \, dz) \, \vec{i} + (u \, dz - w \, dx) \, \vec{j} + (v \, dx - u \, dy) \, \vec{k} = \vec{0} \end{equation*}](https://eaglepubs.erau.edu/app/uploads/quicklatex/quicklatex.com-01bacb58b0e07e7a48ddb2f7b4bd8d84_l3.svg "Rendered by QuickLaTeX.com")
In terms of the components, then
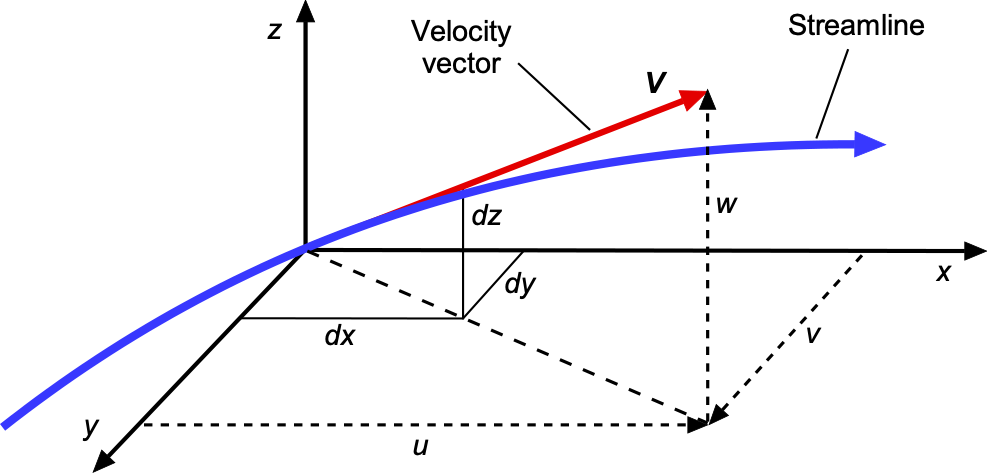
(67) ![\begin{eqnarray*} \frac{dz}{dy} = \frac{w}{v} \quad & \mbox{or} & \quad \frac{dz}{w} = \frac{dy}{v} \\[8pt] \frac{dz}{dx} = \frac{w}{u} \quad & \mbox{or} & \quad \frac{dz}{w} = \frac{dx}{u} \\[8pt] \frac{dy}{dx} = \frac{v}{u} \quad & \mbox{or} & \quad \frac{dy}{v} = \frac{dx}{u} \end{eqnarray*}](https://eaglepubs.erau.edu/app/uploads/quicklatex/quicklatex.com-8dcaf8ef6918cfdd467c4bead9714b6f_l3.svg "Rendered by QuickLaTeX.com")
which can be physically interpreted from the figure below. Therefore, it will be apparent that the equation of a streamline is
(68) 
Streamlines, Pathlines & Streaklines
As previously discussed, by definition, a streamline is a line drawn tangential to the instantaneous local velocity vector field, i.e., there is no flow perpendicular to a streamline. Streamlines can be considered an instantaneous realization or “snapshot” of the flow. A pathline is the trajectory or path a fluid element traces out in time, i.e., following the path of the fluid element as it moves through the flow. A streakline is the locus of fluid elements that have passed through the same point in the flow.
In general, streamlines are different from both pathlines and streaklines. In steady flow problems, when the flow properties do not change with respect to time, called a steady flow, then streamlines, pathlines, and streaklines are all one and the same. In an unsteady flow, the path followed by a fluid element, i.e., the pathline, is not the same as the streamline, as shown in the figure below. At each instant in time, the airfoil reaches a new angle of attack to the flow, and the streamline pattern changes. The fluid element, however, moves along its own pathline as it traces its way through the flow. This is why streamlines are referred to as an instantaneous realization or snapshot of the flow. In contrast, the pathlines and the streaklines depend on the prior history of the velocity field.

Frames of Reference
An interesting issue in fluid dynamics and the calculation of streamlines is the frame of reference. The question usually is: Is the body moving in a stationary flow, or is the flow moving past a stationary body, and are they equivalent? The answer lies in the frame of reference.
One frame of reference is to think of a moving body in stationary flow, as shown in the figure below. In this frame of reference, the airfoil moves through the air, which is considered undisturbed and stationary. The other frame of reference, a stationary body in a moving flow, is a typical setup for wind tunnel testing, theoretical analyses, and numerical simulations. In this frame, the airfoil is stationary, and the air flows past it. This setup is also used because it simplifies the boundary conditions and problem setup. Notice, however, that the streamline patterns will be different in each case. In the case of a stationary body, an observer will see the same streamline pattern for all time. In the case of the moving body, an observer will see that the initially stationary flow will see a streamlined pattern develop and then return to its undisturbed state, i.e., the observer views the behavior as an unsteady flow.
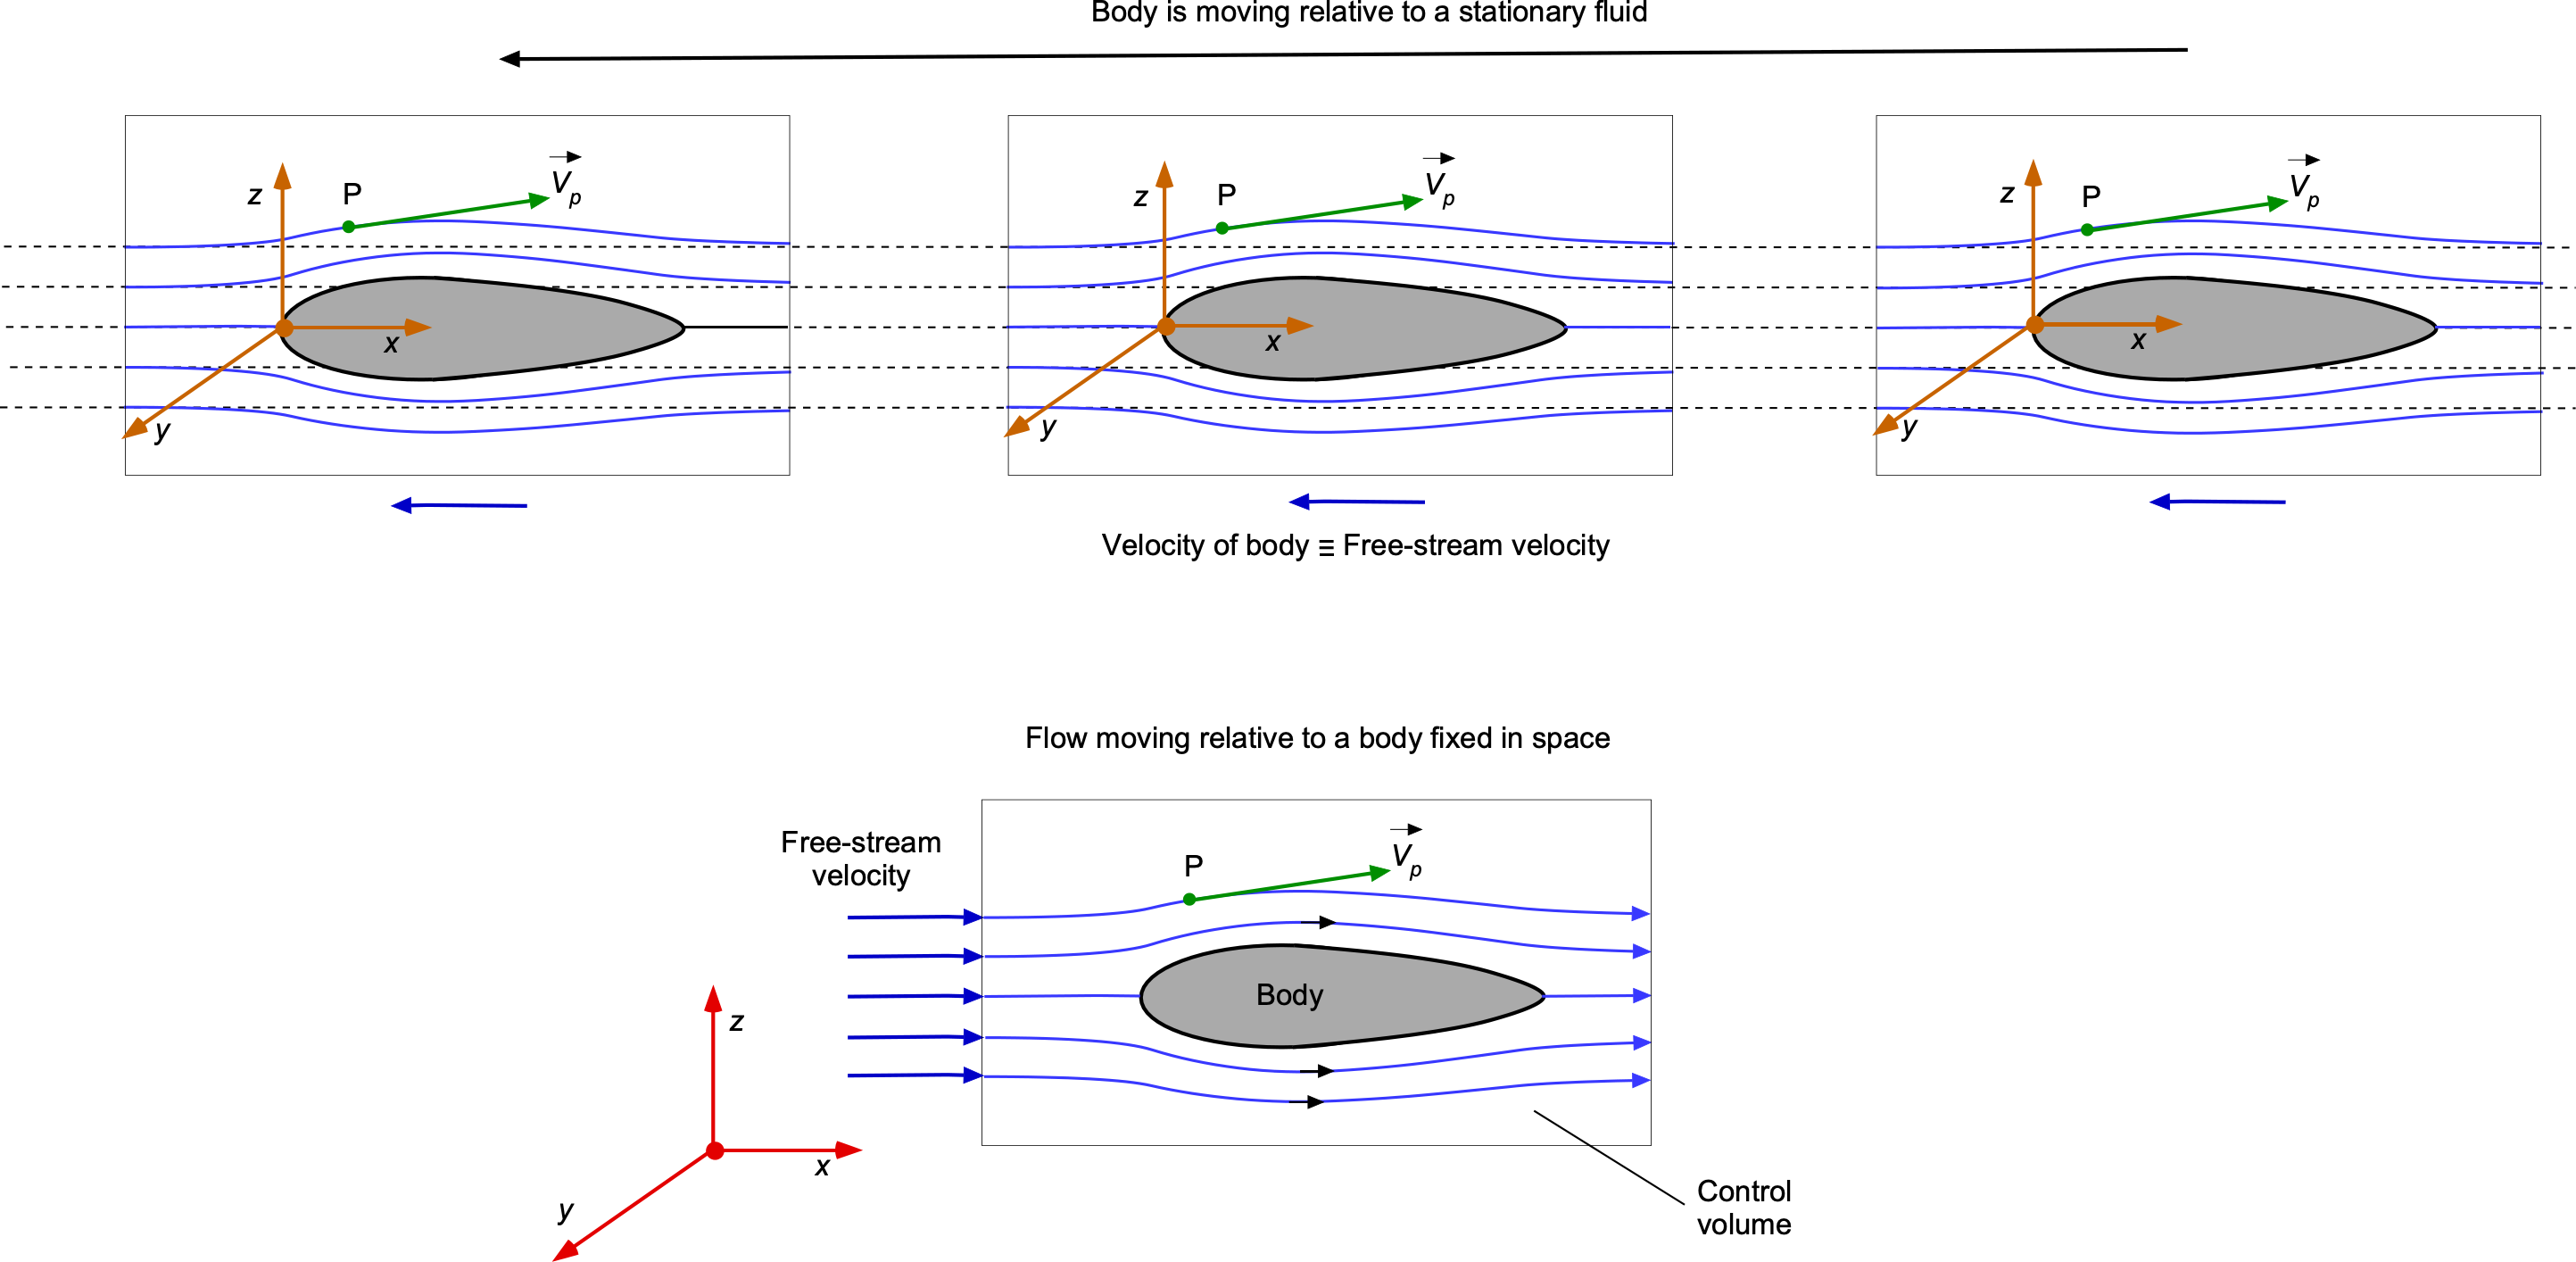
Mathematically, both frames of reference are equivalent because of the principle of relativity for non-accelerating frames. This means the physical phenomena observed or measured, such as lift, drag, and pressure distribution, will be the same regardless of whether the airfoil moves through the air or the air moves past the airfoil. However, the choice of frame can affect the complexity of the analysis and the implementation of numerical methods.
Check Your Understanding #4 – Calculating the equation of a streamline
If a two-dimensional velocity field in the – plane is defined as  , then what are the mathematical equations of the streamlines?
Show solution/hide solution.
In this case, the governing equation for the streamline is
![\[ \frac{dy}{dx} = \frac{v}{u} = \frac{-x}{y} \]](https://eaglepubs.erau.edu/app/uploads/quicklatex/quicklatex.com-e0d976aea212e32b4aebe6c86643dd2b_l3.svg "Rendered by QuickLaTeX.com")
Separating the variables and integrating them gives
![\[ \int y dy = -\int x dx + C_1 \]](https://eaglepubs.erau.edu/app/uploads/quicklatex/quicklatex.com-30af39abd4a26a023ff86bb4fb290fe7_l3.svg "Rendered by QuickLaTeX.com")
where  is a constant, so then
![\[ \frac{y^2}{2} = -\frac{x^2}{2} + C_1 \]](https://eaglepubs.erau.edu/app/uploads/quicklatex/quicklatex.com-0af3a9ae8fe51850331ddfdcd9de9c65_l3.svg "Rendered by QuickLaTeX.com")
or just
![\[ x^2 + y^2 = \mbox{~constant} = C_2 \]](https://eaglepubs.erau.edu/app/uploads/quicklatex/quicklatex.com-f02a6f349104179c1c849635f3f20fdf_l3.svg "Rendered by QuickLaTeX.com")
which, for different values of  , are concentric circular streamlines centered around the origin.
In a more general sense, the streamline equations are often solved using a parameter , which can be thought of as time or another parameter that varies along the length of a streamline, i.e.,
(69) 
To find the streamline, integrate each equation with respect to , i.e.,
(70) 
(71) 
(72) 
where  is the starting point of the streamline at
  .
.
Numerical integration methods available include Euler’s method, Runge-Kutta methods, etc. Second-order Runge-Kutta methods are commonly used to calculate streamlines. If the time step is small enough, an explicit Euler method will be sufficient for calculating the streamlines in two dimensions. For example, for the component, a one-step explicit method for a given time step  is of the form
![\[ x^{(t+\Delta t)} = x^t + u(x^t,y^t) \, \Delta t \]](https://eaglepubs.erau.edu/app/uploads/quicklatex/quicklatex.com-6b6d42cdbd9bf4641ef73fa35a4f4730_l3.svg "Rendered by QuickLaTeX.com")
and for the component
![\[ y^{(t+\Delta t)} = y^t + v(x^t,y^t) \, \Delta t \]](https://eaglepubs.erau.edu/app/uploads/quicklatex/quicklatex.com-f3b82c69a94cacdc76571e579275c228_l3.svg "Rendered by QuickLaTeX.com")
where represents the current time step and  represents the next time step. This algorithm is easily programmed, and if and
  are given as some simple function of and , then the streamlines can be solved. However, the value of must be small enough to prevent errors from accumulating in the values of and , and some trial and error may be involved. Some trial and error may also be needed to find suitable initial points to integrate from so that the nature of the flow field becomes apparent.
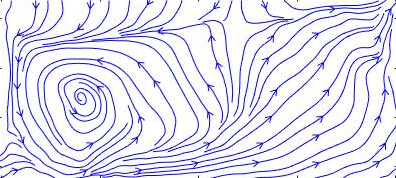
MATLAB has various solvers for initial value problems for ODEs and can be used to trace pathlines and streamlines in simple flows; an example is shown below. However, the accuracy of the streamline calculations depends strongly on the spatial and quality of the velocity field that can be calculated or measured and not just the accuracy of the numerical method.
Streamtubes
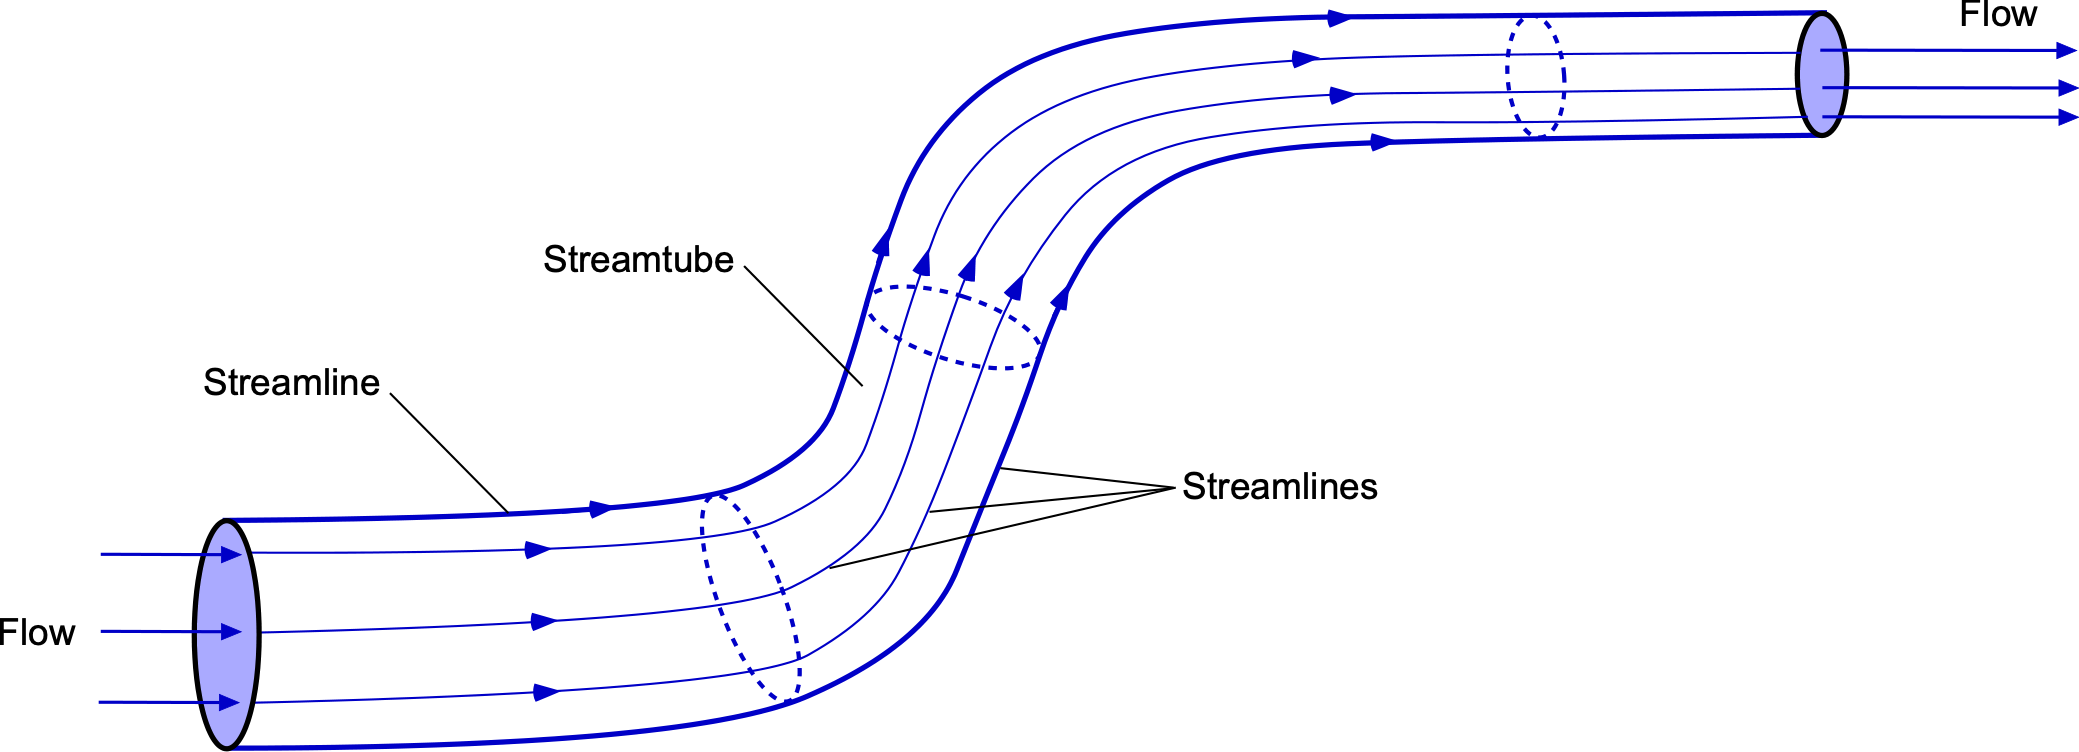
A streamtube is a concept used in fluid dynamics to represent a bundle of streamlines. These streamlines delineate the boundaries of a particular flow or control volume as a tubular structure, as shown in the figure below. Within a streamtube, the mass flow rate of fluid entering one end must equal the mass flow rate exiting at the other end by the principle of conservation of mass. This means that the mass flow rate within the boundaries of the streamtube is constant; there is no mass flow over the boundaries of a streamtube. Streamtubes are often considered axisymmetric flows in that the fluid properties are radially symmetric or uniform at any one section. A uniform axisymmetric flow through a streamtube is a common assumption when learning fluid dynamics.
Speed of Sound in Fluid Media
The speed of sound in any medium depends on how quickly vibrational energy can be transferred from molecule to molecule through the medium. All gases are compressible, so pressure disturbances produced at one point will quickly propagate to another point but at a finite speed. This propagation speed is called the speed of sound, given the symbol  , and its value differs from gas to gas. Sound waves oscillate very rapidly, causing compressions and rarefactions in the medium. The time scale for these oscillations is usually so short that there is insufficient time for significant heat exchange with the surroundings, making the process thermodynamically reversible. Therefore, sound propagation can be assumed adiabatic.
Speed of Sound in a Gas
It can be shown, in general, that the speed of sound is related to changes in pressure and density of the fluid medium using
(73) 
For an adiabatic process, then
(74) 
where is the ratio of specific heats, i.e.,  . In the compression and rarefaction of a gas, the sound waves occur so quickly that they can be considered adiabatic processes; the rapid oscillations of pressure and density do not allow significant heat exchange. Solving for gives
(75) 
so that
(76) 
using  where is the specific gas constant. Therefore, the speed of sound in a gas depends on the gas type and the absolute temperature of that gas.
Because liquids and solids are very difficult to compress and change their density, the speed of sound in such media is generally greater than in gases, e.g., sound travels about four times faster in water than in air. Notice that the values of and differ for different gases; a useful table is given below.
| Gas | |
( J kg K) |
(ft-lb slug R) |
|---|---|---|---|
| Air | 1.4 | 287.05 | 1717.0 |
| Nitrogen | 1.4 | 296.8 | 1775.0 |
| Hydrogen | 1.41 | 4124.2 | 24663.0 |
| Helium | 1.66 | 2077.1 | 12421.0 |
| Oxygen | 1.395 | 259.84 | 1554.0 |
| Carbon Dioxide | 1.289 | 188.92 | 1130.0 |
| Carbon Monoxide | 1.4 | 296.84 | 1775.0 |
Caution should be exercised to ensure that in equations involving the gas constant , the value of is not only for the correct gas but also in the appropriate engineering units. For air the gas constant, , is 286.9 J kg K in the SI system and 1716.49 ft lb slug R in the USC system. Also, = 1.4 for air, which is non-dimensional.
Check Your Understanding #5 – Calculating the speed of sound in a gas
At 300C, estimate the speed of sound in (a) nitrogen, (b) hydrogen, and (c) helium. Hint: The ratio of specific heats and the gas constants for these gases are listed in the table above.
Show solution/hide solution.
(a) For nitrogen,  ,
,  J kg K, and
  C
C K.
K.
![\[ a = \sqrt{\gamma \, R \, T} = \sqrt{ 1.40 \times 296.8 \times 573.15} = 488.8~\mbox{m/s} \]](https://eaglepubs.erau.edu/app/uploads/quicklatex/quicklatex.com-fbc038c65526cb09f832a2b9df5c2498_l3.svg "Rendered by QuickLaTeX.com")
(b) For hydrogen,  ,
,  J kg K, and
  K.
K.
![\[ a = \sqrt{\gamma \, R \, T} = \sqrt{ 1.41 \times 4124.2 \times 573.15} = 1,725.4~\mbox{m/s} \]](https://eaglepubs.erau.edu/app/uploads/quicklatex/quicklatex.com-ff0584f4166449b2e49a343f6c9f947c_l3.svg "Rendered by QuickLaTeX.com")
(c) For helium,  ,
,  J kg K, and K.
![\[ a = \sqrt{\gamma \, R \, T} = \sqrt{ 1.66 \times 2077.1\times 573.15} = 1,417.1~\mbox{m/s} \]](https://eaglepubs.erau.edu/app/uploads/quicklatex/quicklatex.com-cae50ce11083cde830c0ee4ea1722155_l3.svg "Rendered by QuickLaTeX.com")
Doppler Effect
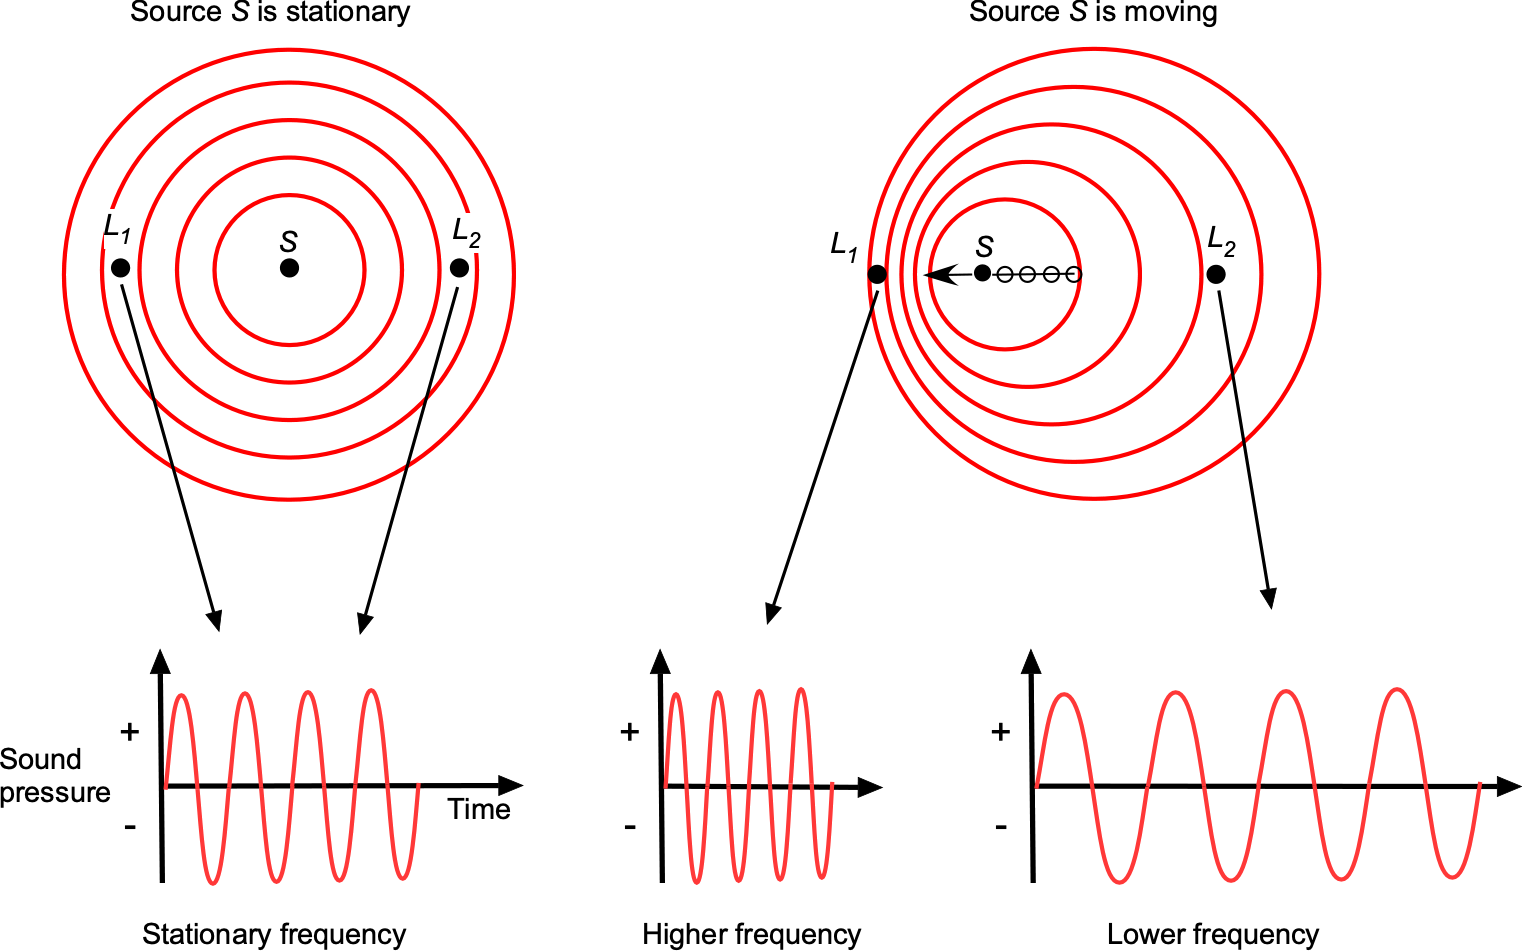
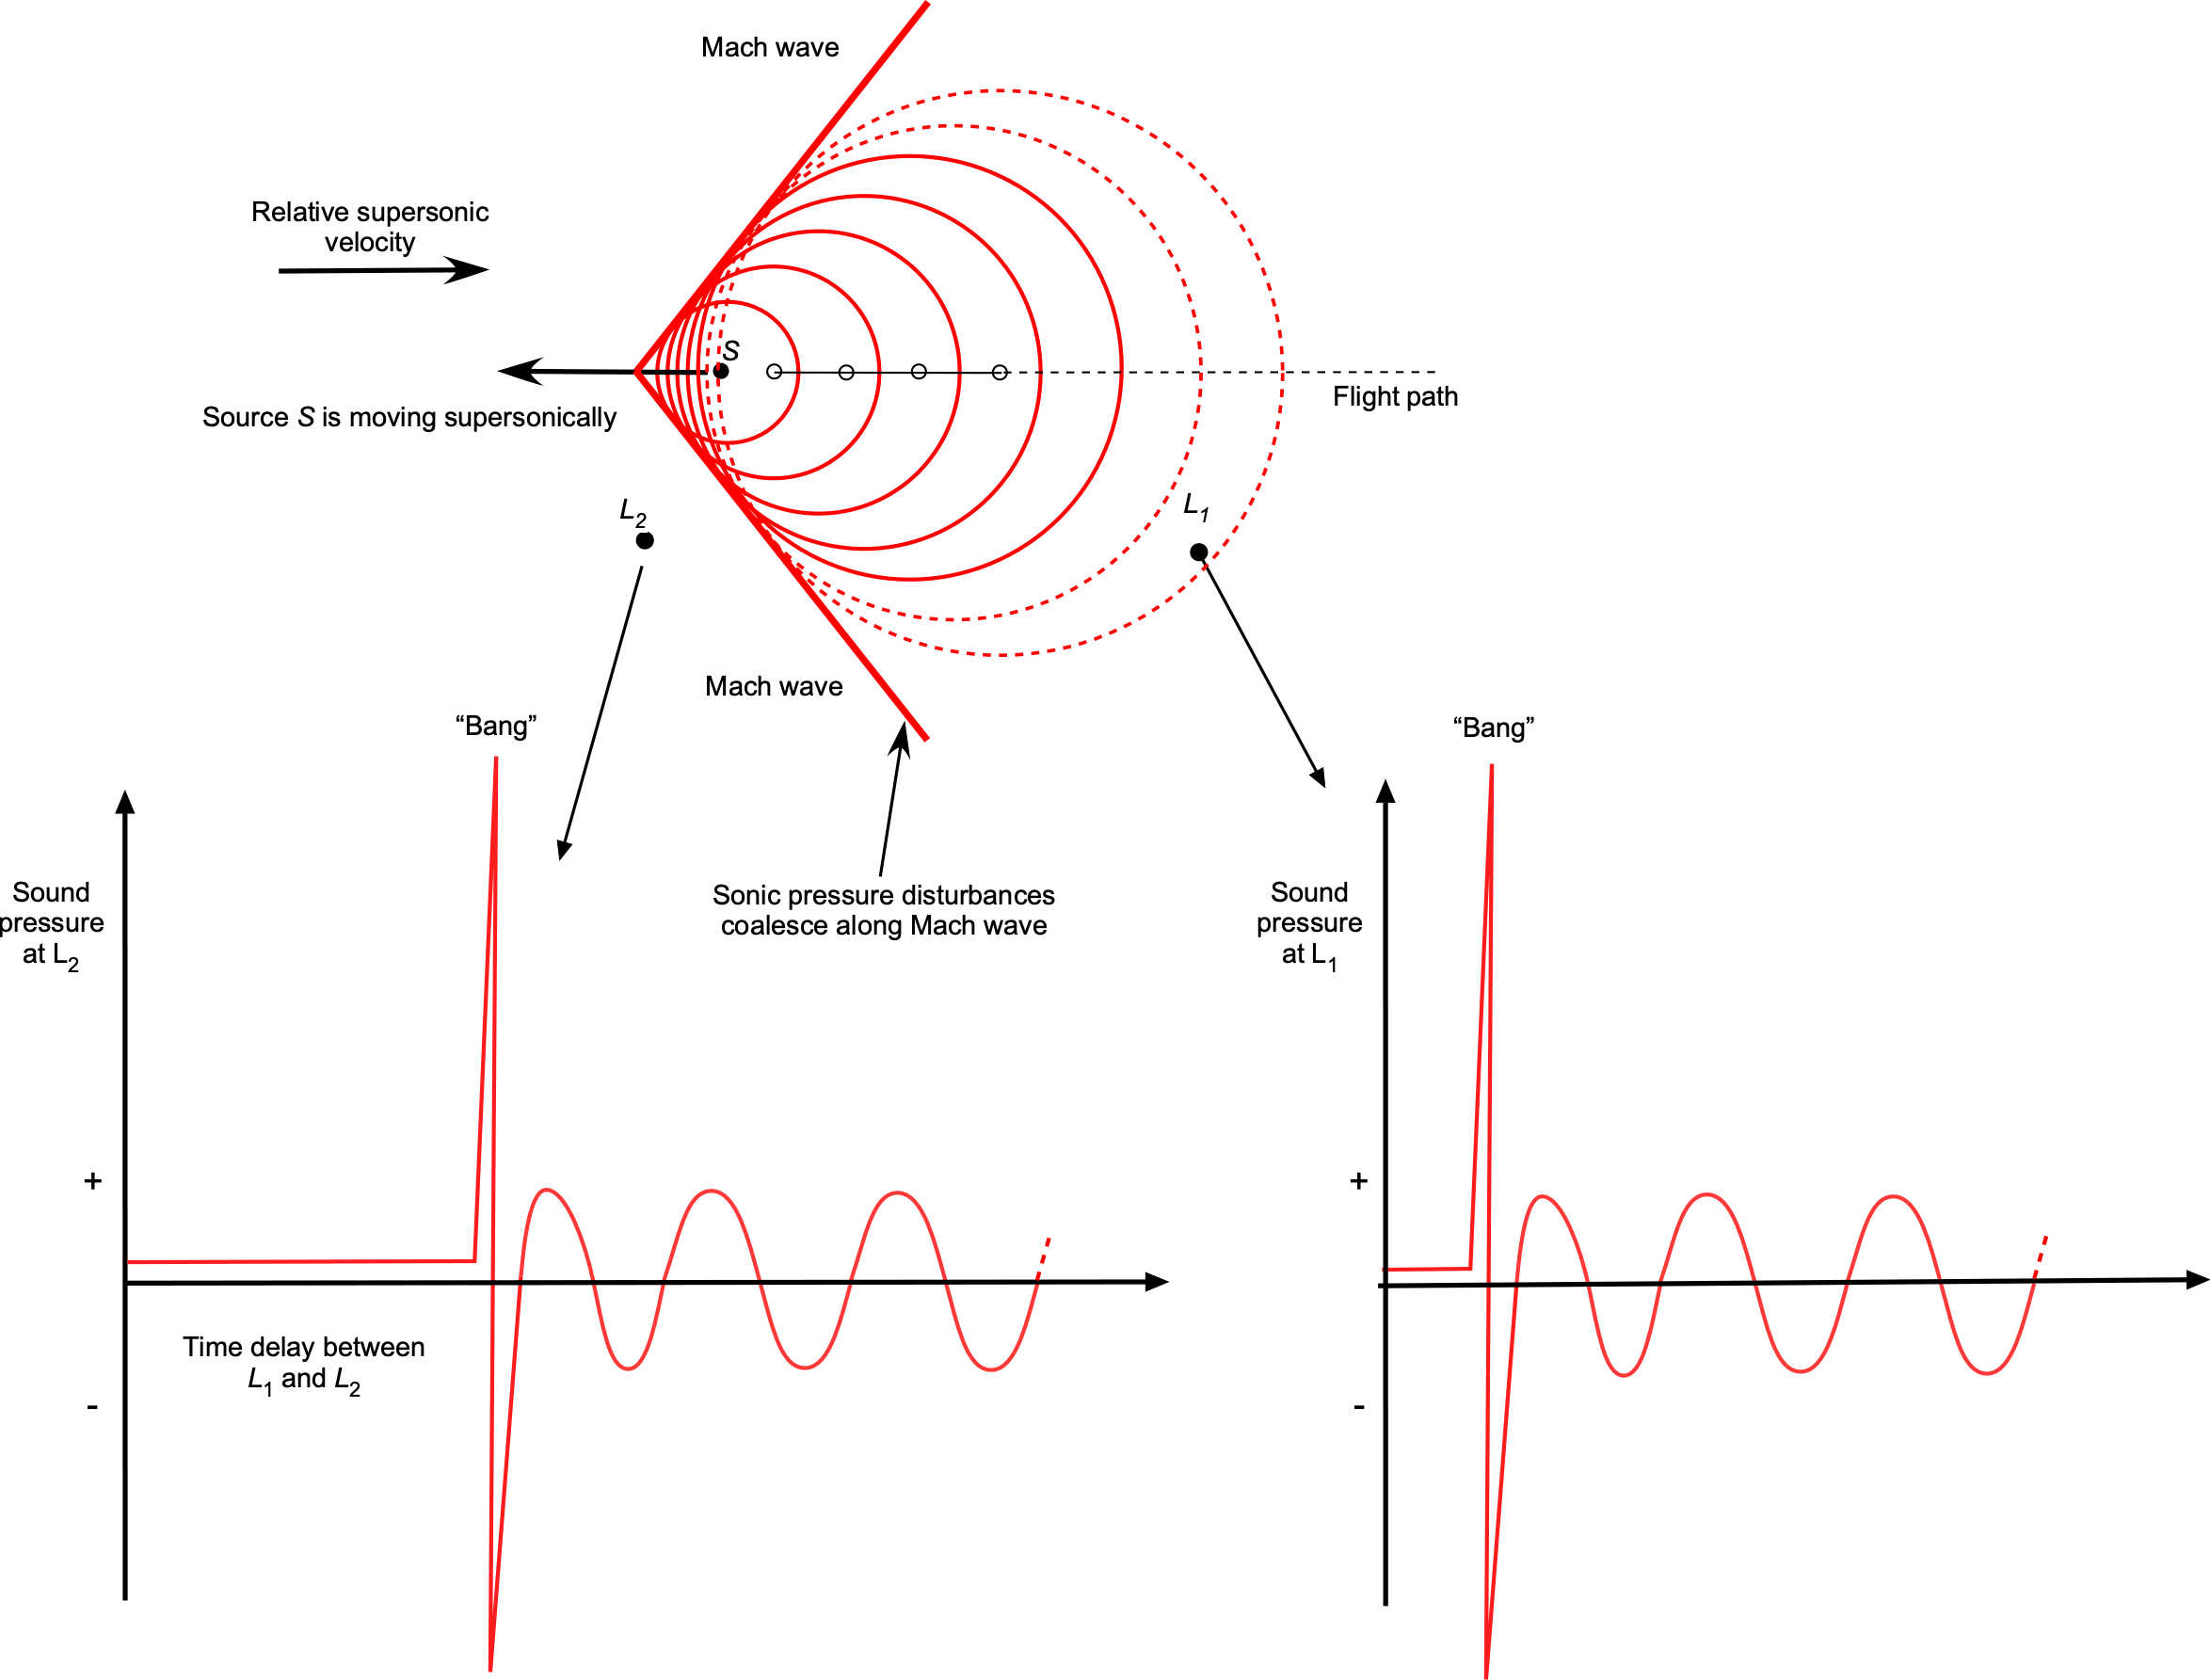
Sound is a pressure disturbance, and the speed of sound propagation in any gas at a given temperature will be constant. Let the frequency of the sound source be  , which will be the frequency of the sound heard by any listener if the sound source is stationary. However, the perceived frequency of sound propagation will change if the location of the sound source S and the listener locations (comparing locations L1 and L2) are in relative movement to each other, which is known as the Doppler effect, as illustrated in the figure below.
The frequency  , heard by the listener is given by
(77) 
where  and
and  are the relative velocity and Mach number of the source, respectively, and
  and
and  are the relative velocity and Mach number, respectively, of the listener, and
  is the frequency of the sound source. It is important that the correct signs are used on and . If
  (listeners are stationary), then the value of will be positive if the sound source moves away from the listener, and will be negative if the source moves toward the listener. Therefore, as shown in the figure above, the listener at
  ahead of the sound source will hear a higher frequency than the listener at
  who is behind the sound source.
Notice that when the sound source starts to move supersonically, i.e., when  , the frequency becomes infinite, which means that the sound becomes concentrated over a wavefront, known as a Mach wave. In three dimensions, this wavefront is called a Mach cone. In this case, a listener upstream of the sound source would not hear it coming until this Mach cone reaches the listener, in which case there would be a loud “bang” as it passes by, as shown in the figure below.
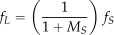
In this case, the lower frequency heard by a stationary listener after the passage of the sound source traveling at a Mach number of will be
(78) 
The speed of sound is critical for all flight vehicles, which create pressure disturbances as they fly. The airspeed of an aircraft relative to the speed of sound affects the flow physics and the forces produced on the aircraft, this ratio being called the flight Mach number,  . If the aircraft flies much slower than the speed of sound, the conditions are said to be subsonic, and compressibility effects are minor. However, if the aircraft moves faster and approaches or exceeds the speed of sound, called supersonic, compressibility effects become essential, and the flow physics will change. In this case, the issue of the “sonic boom” generated by the aircraft also becomes a consideration for people on the ground.
Speed of Sound in a Liquid
The speed of sound in a liquid varies depending on the type of liquid and its properties, including its density, , and its bulk modulus,  . The speed of sound in a liquid can be calculated using
(79) 
where the bulk modulus of the liquid, which, as previously explained, is a measure of its incompressibility. Equation 79 is often referred to as the Newton-Laplace equation.
Sound travels much faster in media with higher values of bulk modulus because it more readily transmits pressure changes. For example, the speed of sound in freshwater at average room temperature is approximately 1,482 m/s ( 4,850 ft/s). The speed of sound in seawater is generally higher because of the presence of salts and minerals, averaging around 1,533 m/s ( 5,029 ft/s) at similar temperatures. In general, the speed of sound can vary widely in different liquids; e.g., in ethanol, it is around 1,160 m/s ( 3,807 ft/s), and in mercury, it is about 1,450 m/s ( 4,760 ft/s). For reference, some numerical values of the bulk modulus for liquids are given in the table below, and others are available online or at other authoritative sources. Notice that bulk modulus has units of pressure. However, it should be appreciated that the temperature and impurities in the liquid can also affect its speed of sound.
| Liquid | (Pa) |
(lb/ft) |
(kg/m) |
(lb/ft) |
(m/s) |
(ft/s) |
|---|---|---|---|---|---|---|
| Freshwater |  |
 |
1,000 | 62.4 | ~1,482 | ~4,850 |
| Seawater |  |
 |
1,025 | 64.0 | ~1,533 | ~5,029 |
| Ethanol |  |
 |
780 | 49.2 | ~1,160 | ~3,807 |
| Mercury |  |
 |
13,600 | 849 | ~1,450 | ~4,760 |
| Glycerol |  |
 |
1,260 | 78.7 | ~1,920 | ~6,299 |
| Benzene |  |
 |
876 | 54.7 | ~1,280 | ~4,200 |
| Methanol |  |
 |
792 | 49.4 | ~1,100 | ~3,609 |
| Olive oil |  |
 |
920 | 57.4 | ~1,370 | ~4,485 |
| Acetone |  |
 |
790 | 49/3 | ~1,210 | ~2,964 |
| Carbon tetrachloride | |
|
1,590 | 99.3 | ~930 | ~3,051 |
Diffusion & Effusion
One interesting characteristic of fluids is their rapid diffusion or mixing ability at the molecular level, even without turbulence or other agitation. Gaseous molecules travel at relatively high speeds, so they collide frequently with other molecules as they travel in many directions. Understanding and predicting the diffusion of gases and other fluids, as well as aerosols[11] or particulates suspended in fluids (colloids),[12] is fundamental to many engineering applications.
Diffusion
Diffusion is a process in which fluid molecules move through a concentration gradient from an area of higher concentration to a lower one until they are more evenly mixed, the idea being shown in the figure below. This movement is driven by the kinetic energy and natural mixing of the molecules and continues until a uniform equilibrium is reached. Diffusion is generally faster in gases because the molecules are further apart and move more freely, especially in gases with low molecular weight. Diffusion at the molecular level is relatively slow, but its rate is considerably enhanced by turbulence or other forced processes such as convection.
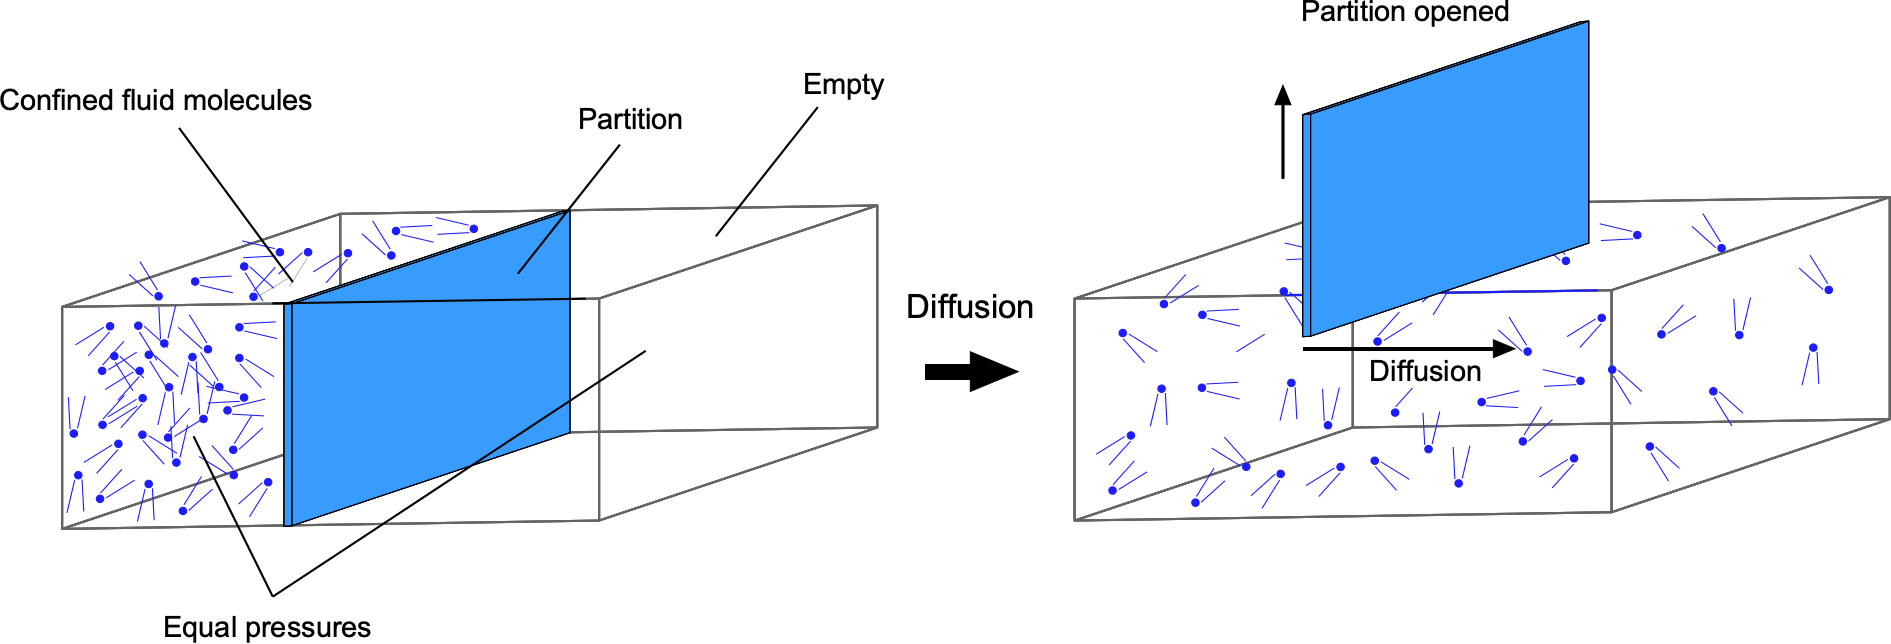
The diffusion characteristics of fluids can be predicted using Fick’s laws, after the work of Adolf Fick. In the case where the concentration gradient is time-invariant, the diffusion flux, J, which is the amount of substance per unit area per unit time, is proportional to the negative gradient of the concentration, C, i.e.,
(80) 
where C is the concentration of the diffusing species, D is the diffusion coefficient, i.e., a measure of the diffusivity, and x is the spatial coordinate. Equation 80 is called Fick’s first law of diffusion. The negative sign in Eq. 80 indicates that the flux occurs in the direction of decreasing concentration. The diffusion coefficient, D, depends on the properties of the fluid, including its viscosity and temperature. Fick’s law is empirical in origin and was developed by following the work of Thomas Graham.
Fick’s first law of diffusion can also expressed in terms of densities, with the concentration, C, being replaced by the density . The density represents the mass per unit volume instead of the number of particles per unit volume. This alternative form of Fick’s first law is given by
(81) 
where J is the mass flux of a substance that flows through a unit area per unit time. In this form, Fick’s first law can be stated that the mass flux of a substance is proportional to the density gradient of that substance, with the direction of flux being opposite to the direction of the gradient. Fick’s law can also be expressed in terms of molecular mass, which is usually referred to as Graham’s law.
Note on units in Fick’s law
If the concentration, C, is measured in moles, as in Eq. 80, which is the classic form, the diffusive flux, J, representing the amount of substance that flows through a unit area per unit time, will have units of mol m s. The diffusion coefficient or diffusivity, D, will be in units of m s. If the concentration is measured in terms of density, as in Eq. 82, which will be in units of kg m , the diffusive flux, J, will be in units of kg m s, with the diffusivity, D, still in units of m s.
Fick’s second law applies to non-steady-state diffusion, where the concentration within the diffusion medium changes with time, which is expressed by
(82) 
For practical problems involving the diffusion of gases, an important application of Fick’s second law is in estimating the diffusion time for spherical spreading. This is particularly useful in scenarios where a substance is diffusing from or to a spherical source, such as a gas bubble in a liquid or a spherical grain in a gas. The diffusion time, , can be approximated by
(83) 
where is a characteristic length scale of the diffusion process. In this context, is typically the radius of the sphere or the effective diffusion distance. Although derived for a special case of spherical diffusion, the approximation in Eq. 83 has been found to be suitable for most practical problems involving the diffusion of gases, i.e., it is justified because at longer downstream distances a spherical front becomes increasingly planar.
In aerospace applications, diffusion is a fundamental mechanism for combustion processes. It is also an important mechanism for air conditioning systems on flight vehicles, ensuring breathable air and removing carbon dioxide and other contaminants. In advanced materials, the diffusion of resin and curing agents affects the final mechanical properties and performance of composites.
Check Your Understanding #6 – Diffusion of a gas in air
An initial volume of ammonia gas diffuses along a 1 m length of duct that has a cross-sectional area of 0.35 m. The opposite end of the duct initially has a 10% ammonia concentration compared to the other end. The temperature and pressure are constant. The diffusivity of ammonia in the air under these conditions is 2.2 10 m/s. Estimate the rate of diffusion of the ammonia through the duct. Approximately how long will it take before the ammonia becomes uniformly diffused?
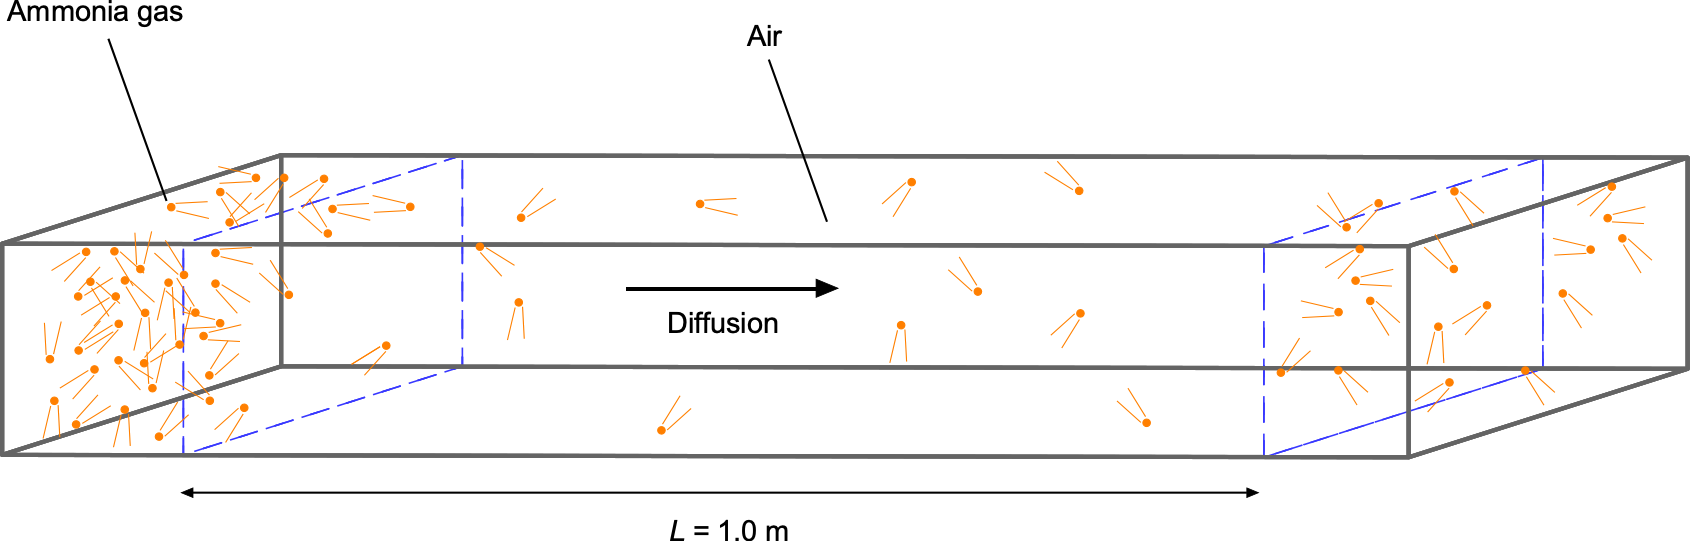
Show solution/hide solution.
The concentration gradient is given by
![\[ \frac{dC}{dx} = \frac{C_1 - C_2}{L} = \frac{1 - 0.1}{1.0} = 0.9 \ \text{mol}~\text{m}^{-4} \]](https://eaglepubs.erau.edu/app/uploads/quicklatex/quicklatex.com-7259fd9ec7848f052e42ebaf65c50847_l3.svg "Rendered by QuickLaTeX.com")
The flux  is
is
![\[ J = -D \left( \frac{dC}{dx} \right) = -2.2 \times 10^{-5} \times 0.9 = -1.98 \times 10^{-5} \ \text{mol} ~\text{m}^{-2}~\text{s}^{-1} \]](https://eaglepubs.erau.edu/app/uploads/quicklatex/quicklatex.com-cc7b369c53a5952bd4b4c193d33c1b61_l3.svg "Rendered by QuickLaTeX.com")
where the diffusivity is 2.2 x 10⁻⁵ m2 s-1; this means that ammonia diffuses through the air at a rate of 2.2 x 10⁻⁵ square meters per second, which is relatively low. Therefore, in this case, the rate of diffusion (moles per second) will be
![\[ \overbigdot{n} = J \, A = -1.98 \times 10^{-5} \times 0.35 \, \text{m}^2 = -6.93 \times 10^{-6} \, \text{mol} ~\text{s}^{-1} \]](https://eaglepubs.erau.edu/app/uploads/quicklatex/quicklatex.com-0c7635bd527e174781477d2faaf90730_l3.svg "Rendered by QuickLaTeX.com")
The diffusion time is given by
![\[ t \approx \frac{L^2}{6D} \]](https://eaglepubs.erau.edu/app/uploads/quicklatex/quicklatex.com-7c886db3d20d68a2fdff066e43aaf599_l3.svg "Rendered by QuickLaTeX.com")
which comes from Fick’s second law. Substituting values gives
![\[ t \approx \frac{(1 .0)^2}{6 \times 2.2 \times 10^{-5}} \approx 7,575 \, \text{s} \]](https://eaglepubs.erau.edu/app/uploads/quicklatex/quicklatex.com-221037c64cd0d283f66fdeddcd044f9f_l3.svg "Rendered by QuickLaTeX.com")
Therefore, ammonia will take approximately 2.1 hours to uniformly diffuse throughout the 1 m long section.
Effusion
Effusion refers to the escape of fluid molecules through a porous surface or a tiny hole, the underlying process being similar to diffusion, as shown in the figure below. In this case, molecules move through the holes in a metered fashion at a rate related to their kinetic energy and molecular size, i.e., the faster the molecules move and the smaller they are, the more frequently they will pass through a given size of hole in a given time, and so move from one side of the porous surface to the other.
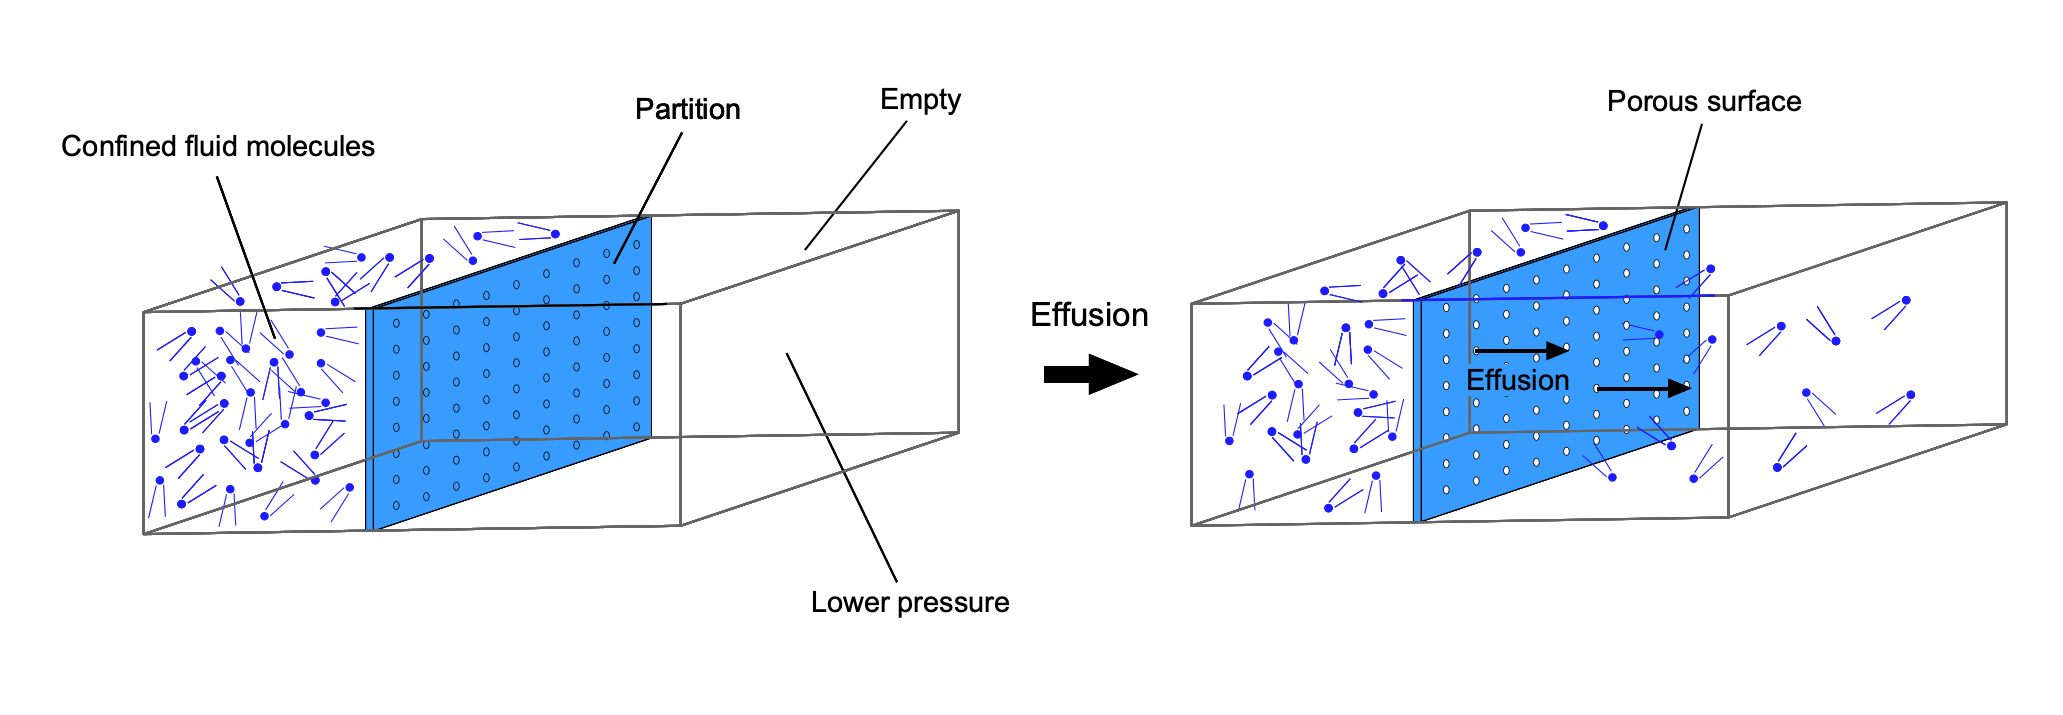
The behavior of effusion, as well as diffusion, can be predicted using Graham’s law. Graham’s law states that the rate of effusion or diffusion of a given gas is inversely proportional to the square root of its relative molecular mass, i.e.,
(84) 
where  and
and  are the rates of effusion or diffusion of gases 1 and 2, respectively, and
  and
and  are the relative molecular masses of gases 1 and 2, respectively.
The proof of this result can be developed from the kinetic theory of gases, which states that the average kinetic energy of gas molecules is proportional to their absolute temperature, , i.e.,
(85) 
where is the mass of a gas molecule and is the average root-mean-square speed of the molecules. The average kinetic energy of one mole of gas (which contains molecules, where is Avogadro’s number) is also proportional to the absolute temperature, i.e.,
(86) 
where is Boltzmann’s constant. Because the kinetic energy for one molecule or for one mole is proportional to the temperature, then
(87) 
A gas molecule’s mass can be related to its relative molecular mass  by
by  . Substituting gives
(88) 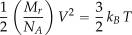
and solving for  gives
gives
(89) 
Because  , where is the universal gas constant, then
(90) 
showing that the root-mean-square speed, , of the molecules is inversely proportional to the square root of their relative molecular mass, .
It can be deduced, therefore, that the rate of effusion,  , of a gas is proportional to the root-mean-square speed of its molecules, i.e.,
(91) 
So, for two different gases (1 and 2) at the same temperature, then
(92) 
which is known as Graham’s law. Stated in words, Eq. 92 shows that the effusion rate is inversely proportional to the square root of its relative molecular mass.
Graham’s law also holds for diffusion, albeit only approximately, but has been proven to work well in practice. Likewise, the effusion or diffusion of one gas mixed with another can be predicted only approximately according to Graham’s law because the interactions between the different gas molecules affect the combined rate. Notice that Fick’s laws focus on diffusion through a medium driven by concentration gradients. Graham’s law focuses on the diffusion rate in terms of their molar masses.
Thomas Graham’s original work, which pertained to the effusion and diffusion of gases, can also be adapted for liquids. Indeed, in practice, Graham’s law represents the diffusion or effusion of a wide range of liquids, albeit approximately. However, it is essential to note that the processes of effusion and diffusion in liquids are somewhat more complicated than gaseous diffusion because of the more frequent intermolecular interactions and viscosity effects, i.e., cohesive bonding. In practical applications, the precise prediction of diffusion rates in liquids often requires some empirical data.
Graham’s law of effusion is also known to work for gases that exit through somewhat larger holes and orifices, in which case the law is often modified to
(93) 
where  is an empirical constant related to the type of gas and the size and shape of the hole or opening. If different gases exit through the same hole size, then the ratio of their effusion rates (but not their rates per se) can be predicted using Eq. 92.
Surface Tension & Capillary Action
Surface tension is the tendency of a liquid-gas interface, or a free-surface between two immiscible fluids to behave like a stretched elastic membrane or “skin.” Capillary action is directly related to surface tension, which is usually understood as describing the behavior of a liquid-gas interface in narrow spaces, usually with the formation of a surface meniscus. Capillary action and surface tension are both phenomena that arise from the relative effects of the behavior of intermolecular forces in fluids. The fluid property of surface tension is widely used in various applications, including lubrication, painting or coating technologies, printing with inks, the production of emulsions and foams, bubble formation, microfluidics, and various manufacturing processes.
Surface Tension
There is a natural tendency for all liquids to minimize their net energy state by minimizing their surface area. For example, the often-observed behavior of a liquid droplet on a horizontal surface wetted by a liquid, such as water “beading” on a surface covered with a thin film of oil or wax, is because of surface tension effects.
Consider the figure below, which shows beads of water sitting on a solid surface. The physics of surface tension can be explained in terms of the relative effects of cohesive forces between the liquid molecules and the adhesive forces between the liquid and the gas at the interface. Away from the surface, the liquid molecules are pulled uniformly in every direction by the cohesive forces from neighboring molecules, giving zero resultant force. As the interface or free surface is approached, however, the forces on the molecules are no longer uniform. At all the liquid–gas interfaces, there is a much greater attraction between the liquid molecules (cohesion) than to the molecules in the gas (adhesion). Therefore, in this case, the free surface of the water tends to be pulled inward by the water molecules below the surface, giving it a characteristic surface curvature.
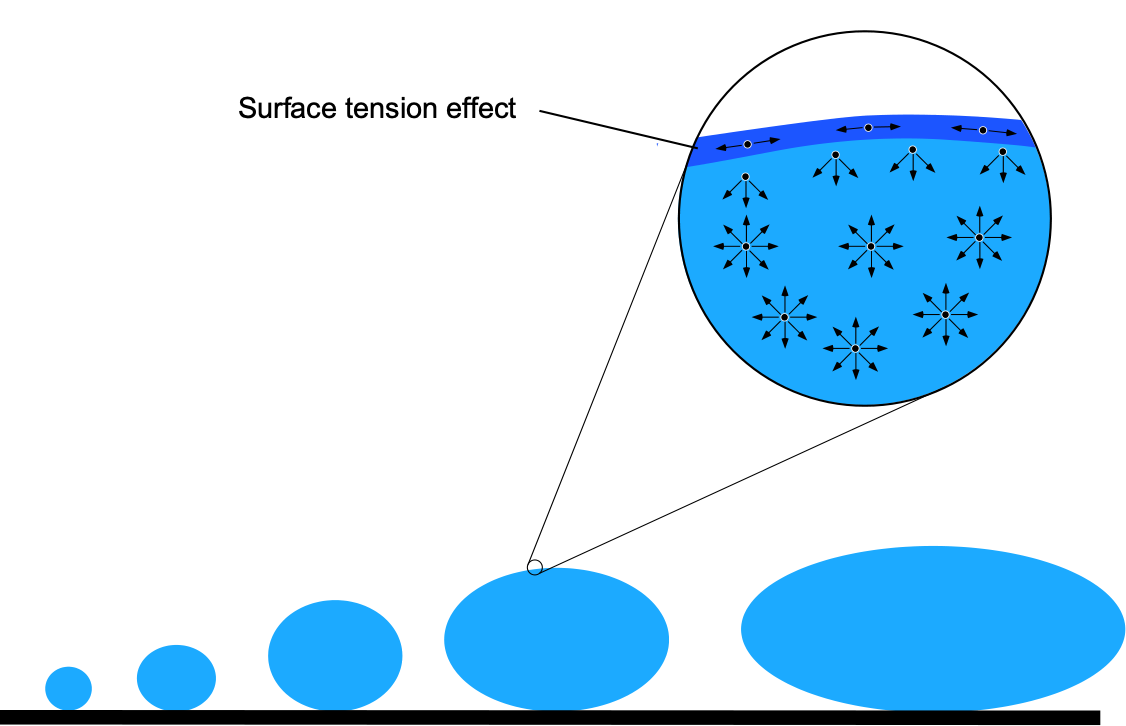
For small water droplets sitting on a surface, as shown in the figure above, it will be noticed that the droplet is almost perfectly spherical because, in this configuration, there is the least surface area for a given volume. For larger droplets, the shape becomes somewhat flatter and bulges because of the increasingly important effects of gravity, which is roughly proportional to the weight of the droplet, i.e., proportional to  where is the approximate radius of the droplet.
This latter situation is very similar to that of a water-filled balloon; the water’s weight accounts for the gravitational effect, and the balloon’s skin stretches as the water volume increases, miming the effects of surface tension. Because the surface area is proportional to  , the gravitational to surface tension ratio depends on the ratio
  ; this latter effect becomes increasingly important for larger droplets.
Surface tension, which is usually represented by the symbol  (although sometimes is used – so symbol conflict arises again), has units of force per unit length. The base units of surface tension are Newtons per meter (N/m) in SI units or pounds per foot (lb/ft) in USC units. The Young-Laplace equation describes the pressure difference across a curved liquid-gas interface resulting from surface tension.
Consider a small, curved element of the liquid surface, i.e., part of a spherical or cylindrical cap defined by two principal radii of curvature,  and
and  , as shown in the figure below. Although signs for these values can vary, sign convention usually dictates positive curvature when it is convex and negative when it is concave. The curvature of the surface affects how the surface tension forces act.
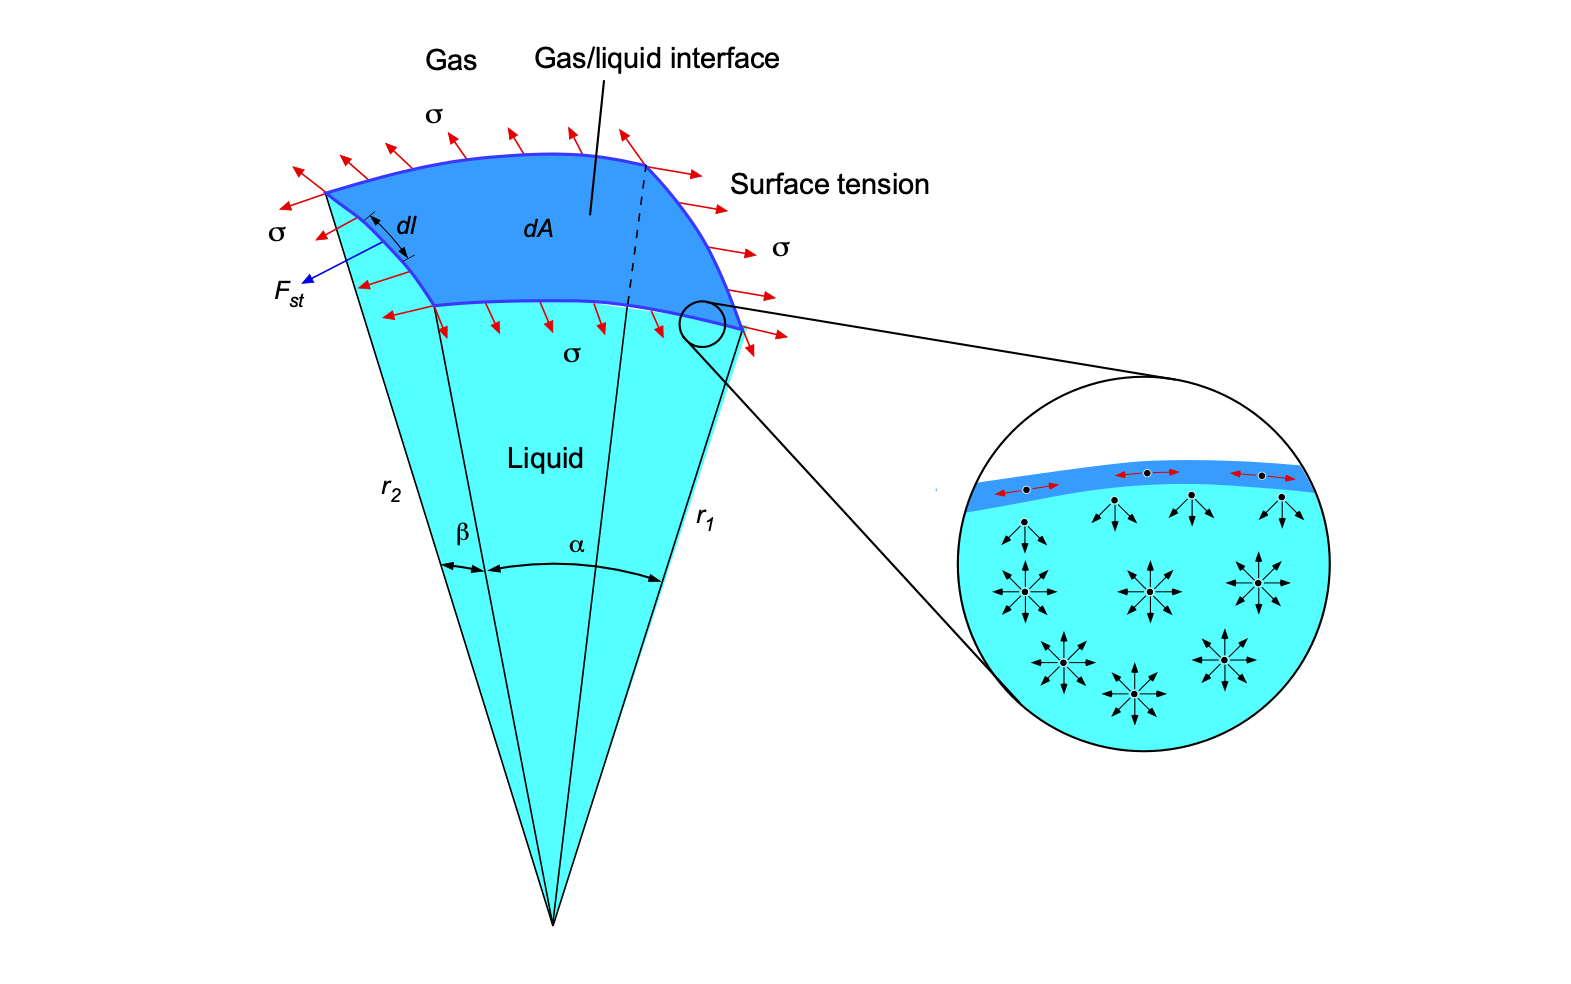
The surface tension acts tangentially along the boundary of the patch. For an infinitesimal short boundary length  , the force from surface tension is
(94) 
The pressure difference across the surface, , which, because it is a liquid/gas interface, is usually referred to as the capillary pressure or the Laplace pressure, creates a normal force on the patch,  . The surface tension force must balance the capillary pressure force to maintain equilibrium. The net inward force from surface tension on the patch can be approximated by considering the contributions from both radii of curvature, and .
It can be shown that the force from surface tension in one direction is proportional to and inversely proportional to . This outcome is because a smaller radius of curvature (sharper curve) results in a larger force. Similarly, the other radius of curvature, , also contributes an inward force proportional to but is inversely proportional to .
Therefore, the total force from the surface curvature must balance the capillary pressure, i.e.,
(95) 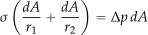
and so leading to
(96) 
This latter relationship is called the Young-Laplace equation. Notice that in the case of spherical shapes such as bubbles or droplets of radius , then  =
=  = and so
(97) 
For cylindrical cases, then = and = 0, so
(98) 
In the general case, for a free surface and where there is an applied “over-pressure,” , at the gas/liquid interface in equilibrium, there is a balance between the applied pressure, the hydrostatic pressure, and the effects of surface tension. In this case, the Young-Laplace equation is modified to give
(99) 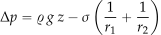
It should be noted that the magnitude of the surface tension depends on the type of liquid and gas and their temperatures. Generally, liquids with stronger intermolecular forces exhibit higher values of surface tension. Water, for example, has a relatively high surface tension because of the significant cohesive bonding between its hydrogen molecules. Surface tension is an essential physical property of most liquids. It is crucial in various engineering and scientific problems, including droplet formation, capillarity and meniscus formation, bubble dynamics, surface coatings, and biological and medical applications.
| Fluid | (N/m) |
(lb/ft) |
|---|---|---|
| Water | 0.0728 | 0.00498 |
| Soapy water | 0.070–0.072 | 0.00479–0.00493 |
| Ethanol | 0.0223 | 0.00153 |
| Methanol | 0.0226 | 0.00154 |
| Glycerol | 0.0631 | 0.00432 |
| Mercury | 0.485 | 0.0332 |
| Benzene | 0.0289 | 0.00198 |
| Acetone | 0.0237 | 0.00162 |
| Olive Oil | 0.032 | 0.00219 |
Check Your Understanding #7 – Calculating surface tension
A student does experiments in the lab to study the properties of surface tension. The student finds that cylindrical steel needles of different diameters,  , and lengths, , will “float” on the water’s surface. A close inspection shows the needle is not under the water, so the flotation effect is not because of buoyancy but entirely of surface tension effects. The student eventually finds that a needle with a diameter of more than 1.6 mm will “break” the surface tension and sink in the water; this outcome is also independent of the length of the needle, . Use this information to estimate the surface tension of water,
  . The density of steel,
  , is 7,830 kg/m
 .
.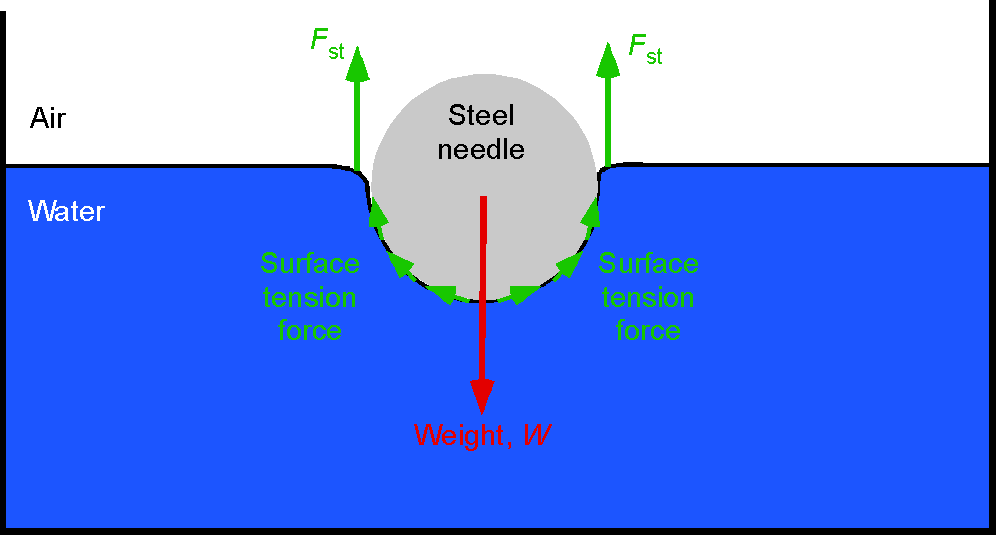
Show solution/hide solution.
The needle deforms the water surface, and the surface tension forces,  , act vertically upward, as shown in the figure. If these tensions are assumed to give a resultant force that is nearly vertical, then force equilibrium between the weight of the steel needle and the surface tension, gives
![\[ 2 F_{\rm st} = \varrho_s \, g \, {\cal{V}} = \varrho_s \, g \left( \frac{\pi}{4} d^2 L \right) \]](https://eaglepubs.erau.edu/app/uploads/quicklatex/quicklatex.com-2ef606c8bac6f10958a8638760959d6e_l3.svg "Rendered by QuickLaTeX.com")
Introducing the surface tension value, , gives
![\[ 2 \sigma_w \, L = \varrho_s \, g \left( \frac{\pi}{4} d^2 L \right) \]](https://eaglepubs.erau.edu/app/uploads/quicklatex/quicklatex.com-39b7884f5f8318746683243422d21890_l3.svg "Rendered by QuickLaTeX.com")
for which is to be determined for = 1.6 mm = 0.0016 m. Rearranging the equation gives
![\[ \sigma_w = \varrho_s \, g \left( \frac{\pi}{8} d^2 \right) \]](https://eaglepubs.erau.edu/app/uploads/quicklatex/quicklatex.com-e9d87b42f635b8e4450c6b24a07cfd37_l3.svg "Rendered by QuickLaTeX.com")
thereby confirming that the surface tension effects will not depend on the length of the needle. Inserting the known numerical values gives
![\[ \sigma_w = 7,830 \times 9.81 \times \left( \frac{\pi}{8} 0.0016^2 \right) = 0.077 ~\mbox{N/m} \]](https://eaglepubs.erau.edu/app/uploads/quicklatex/quicklatex.com-a26dd9d407696e27584471decec5f287_l3.svg "Rendered by QuickLaTeX.com")
This value of compares favorably with the accepted value of 0.0728 N/m for water-air at a temperature of 25C.
Blowing Bubbles!
The formation of bubbles, whether they are gas bubbles in liquids (e.g., carbon dioxide bubbles in a soda or other fizzy drink) or soap bubbles, involve surface tension effects. Gas bubbles in a liquid rise quickly because of their buoyancy, which is proportional to the density difference between the gas inside the bubble and the surrounding liquid. Surface tension plays a critical role in the stability and shape of the bubble. It acts in a manner to minimize the surface energy and, hence, the surface area of the bubble, forming a spherical shape in the absence of other external forces.
For any type of bubble to be in equilibrium with itself in ambient air, the internal pressure of the gas inside the bubble must be greater than the atmospheric pressure by an amount exactly equal to the pressure difference caused by the bubble’s surface tension, as shown in the figure below. This means that for equilibrium, the external pressure exerts an inward force that balances the internal pressure less the surface tension force. Therefore, a bubble will maintain its shape and size if these forces are exactly balanced.
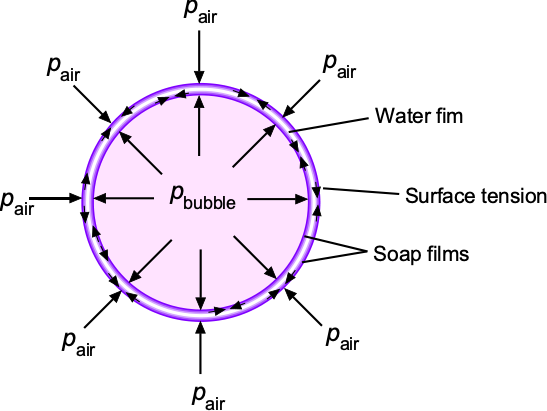
A soap bubble consists of a thin film of water sandwitched between a small amount of soap and enclosing a volume of gas, often air or helium. The total thickness of the film is usually of the order of nanometers (nm). Notice that here are inner and outer soap film surfaces that both carry a surface tension. The internal pressure of the gas inside the bubble is balanced by the atmospheric pressure and the pressure from surface tension. This balance is described by the Young-Laplace equation, i.e., for the case of a sphere, given by Eq. 97, then
(100) 
where is the pressure difference across the bubble’s surface, is the surface tension, and is the radius of the bubble. Because the film has inner and outer soap surfaces, then this result must be multiplied by two, i.e.,
(101) 
Therefore, for bubble equilibrium then
(102) 
Why does soap help form bubbles?
Water has relatively high surface tension because of the hydrogen bonds between water molecules. This charateristic makes it difficult for water to spread out, which inhibits the formaiton of bubbles. Soap is a surfactant, which means it reduces the surface tension of water, allowing it to spread and wet surfaces more easily. Soap molecules reduce the surface tension of water because they disrupt the hydrogen bonds between water molecules, thereby decreasing the surface tension. Therefore, when soap is added to water, it forms a thin film. Blowing air into soapy water stretches this film, thereby creating a bubble! The soap film is stabilized by the soap molecules, which form a layer on both its inner and outer surfaces, sandwiching a thin layer of water between them.
Capillary Action
Narrow-diameter cylindrical tubes are called capillary tubes. If one end of these tubes is dipped in a liquid, as shown in the figure below, it is observed that the liquid in the capillary “wets” the inside of the tube and either rises or falls relative to the surrounding liquid level. This phenomenon is called capillary action. Capillary action occurs at a molecular level because of the intermolecular cohesive attraction between the molecules of the liquid and the adhesive attraction between the capillary walls. Leonardo da Vinci first observed capillary action with water in the late 15th century; he was obsessed with the behavior of water and made hundreds of observations, although he did not develop any physical laws. Today, the physics of capillary action arises in many different engineering and scientific fields, including microfluidics.
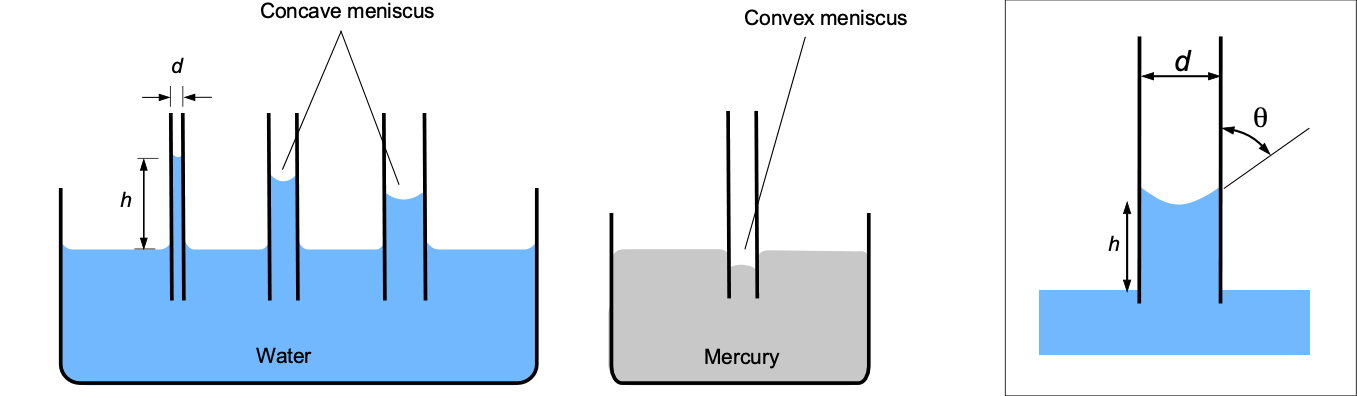
In capillary action, there is a balance of three main forces at play, namely adhesion, cohesion, and surface tension. Adhesion happens when different molecules are attracted to each other. Cohesion is when molecules that are the same cling to each other. If any of the two phenomena, i.e., surface tension and the ratio between cohesion and adhesion, increase, the liquid will rise in the capillary tube. Furthermore, the narrower the tube, the higher the liquid will rise.
Another interesting feature of capillary tubes is the meniscus formation at the liquid-gas interface. A concave meniscus occurs when the attraction between the particles of the liquid and the container (adhesion) is more than the attraction of the particles of the liquid to each other (cohesion), causing the liquid to climb the walls of the container. This behavior occurs between water and glass; water-based fluids will have a concave meniscus in glass or other wettable containers. A convex meniscus occurs when the adhesion energy is less than the cohesion energy. Convex menisci arise, for example, between mercury and glass, which was apparent in the old mercury thermometers.
Jurin’s law, named after the 18th-century physicist James Jurin, mathematically describes the capillary action observed when a liquid rises or falls in a narrow tube. The physics involves the balance between adhesive forces (attraction between the liquid and the walls) and cohesive forces (the attraction between the liquid molecules). When a narrow tube is placed vertically into a liquid, it is found that the liquid either rises or falls. If the liquid wets the tube (such as water in a glass tube), it will rise; if it does not wet the tube (such as mercury in a glass tube), it will fall. According to Jurin’s law, the height to which the liquid rises or falls is given by
(103) 
where is the surface tension of the liquid,  is the contact angle between the liquid and the tube, is the density of the liquid,
  is the acceleration under gravity, and is the diameter of the tube.
Surface tension, , is the force per unit length at the surface of a liquid because of molecular attractions, causing the liquid surface to behave like a stretched elastic membrane. The contact angle, , is the angle at which the liquid interface meets the solid surface, being less than 90o for a liquid that wets the surface and greater than 90o for one that does not. The smaller the diameter of the tube, the higher the liquid will rise or fall because capillary forces exert a stronger effect in narrower tubes. For a concave meniscus, which occurs when the liquid wets the tube walls (e.g., water in a glass tube), the height is measured from the bottom of the meniscus to the free surface of the liquid outside the tube. For a convex meniscus, which occurs when the liquid does not wet the tube walls (e.g., mercury in a glass tube), the height is measured from the top of the meniscus to the free surface of the liquid outside the tube.
Summary of Properties of Air at MSL Standard
Values of the properties of air at standard mean sea-level (MSL) conditions are helpful to have on hand, and these are given in the table below. They are often called MSL ISA conditions, where ISA means International Standard Atmosphere. Air properties at MSL ISA conditions are often used as a standard reference.
| Property | Symbol | SI units | USC units |
| Pressure |  |
1.0132510 Nm (Pa) Nm (Pa) |
2116.4 lb/ft (29.92 inches of Hg) |
| Density | |
1.225 kg m |
0.002378 slugs ft |
| Temperature | |
288.15 K | 518.67 R |
| Dynamic viscosity | |
1.78910 kg m s |
3.73710 slugs ft s slugs ft s |
| Speed of sound |  |
340.3 m s |
1116.47 ft s |
| Gas constant | |
287.057 J kg K |
1716.49 ft-lb slugR |
Summary & Closure
The study of fluids and their behavior underpins a wide range of engineering disciplines and is necessary for solving many practical engineering problems, especially in the aerospace field. The relationships between pressure, density, temperature, viscosity, flow velocity, and the speed of sound help engineers predict and understand fluid behavior in different conditions, such as the flow around airfoils, wings, and complete aircraft. The thermodynamic equation of state helps to calculate fluid properties, considering the interrelated effects of pressure, temperature, and density. The concept of viscosity is important to understand, most physical behaviors with flowing fluids being related to viscous effects. Using the correct units in SI or USC for fluid properties is also essential in ensuring accurate results and maintaining effective communications between engineers. It should be remembered that many fluid parameters and associated physical quantities are not generally expressed in base units, and caution is required in applications.
5-Questions Self-Assessment Quickquiz
For Further Thought or Discussion
- Sometimes, people may feel their ears experience a “popping” sensation when the surrounding pressure changes suddenly, such as going up in an elevator in a tall building. Why?
- Consider some other engineering applications with important pressure effects.
- Use Sutherland’s law and write a short piece of MATLAB code to calculate the coefficient of viscosity of air as a function of temperature.
- Explain the physical mechanism(s) as to why the viscosity of a gas increases with increasing temperature.
- Think about different ways the viscosity of a liquid and/or gas might be measured.
- How might you go about measuring the viscosity of a non-Newtonian fluid?
- Why does the speed of sound decrease at higher altitudes in the atmosphere?
- Does the air’s viscosity in the atmosphere increase or decrease with altitude, and why?
- Why does a hurricane “spin down” as it crosses over land? What are the fluid mechanisms at work here?
- Two party balloons are filled, one with air and the other with helium. They are left to sit for several days. What will happen and why?
- An astronaut spills some water on the ISS. What happens to the water and why?
Other Useful Online Resources
To learn more about fluids and their properties, try some of these online resources:
- Great early film on the differences between normal gases and rarefied gases.
- Understanding viscosity. YouTube video.
- Viscosity demo: Water and oil. YouTube Video.
- What happens when liquids of different viscosity are poured into a container?
- Pressure Demo: Water column. YouTube video.
- A really nice video on understanding viscosity.
- A good video showing some of the properties of non-Newtonian fluids.
- Fluid mechanics covers both fluid statics and fluid dynamics. ↵
- The term "macroscopic" usually refers to phenomena or objects large enough to be observed and measured directly with the naked eye without requiring magnification or specialized instruments. It is often used in contrast to "microscopic," which pertains to things that require magnification to be seen, such as cells or molecules. ↵
- The average distance the molecules travel between collisions. ↵
- William Rankine's hypothesis was that matter was constituted by molecular "vortices" and derived quantities such as "pressure" from that consideration. ↵
- [footnote]The name "slug" as a unit of mass originates from the concept of mass as inertia, i.e., "sluggish," and has been referred to as the "engineer's mass unit." ↵
- It is the coldest possible temperature at which molecules in matter are stationary, i.e., “infinite cold”, as Professor Thompson (Lord Kelvin) sometimes called it. ↵
- In 1848, William Thompson (Lord Kelvin) published a paper titled: “On an Absolute Thermometric Scale founded on Carnot’s Theory of the Motive Power of Heat, and calculated from Regnault’s Observations” Thomson derived the value of −273 °C for absolute zero by calculating the negative reciprocal of 0.0036, which was the coefficient of thermal expansion of an ideal gas per degree Celsius relative to the ice point. He was even closer than his paper indicates because -100/0.366 = -273.22; this value agrees with the currently accepted value of −273.15 °C. ↵
- Experiments by Jean Baptiste Perrin led to the definition of the Avogadro number as the number of molecules in one gram-molecule of oxygen. Perrin named it the Avogadro's number in honor of Avogadro. Standardization of the SI system then led to the formal definition of the Avogadro constant. ↵
- In medical ultrasound imaging, the speed of sound in tissues and fluids (like blood) is critical for accurate imaging and diagnosis. Variations in sound speed can indicate abnormalities in tissue density or fluid composition, aiding in the detection of tumors, lesions, or other medical conditions. ↵
- Sound is the primary means of communication and detection in underwater environments. The speed of sound in water determines how quickly signals can propagate, impacting communication, navigation, and detection systems used in underwater applications such as sonar. ↵
- Aerosols can have a dispersed phase of liquids (e.g., fog) or solids (e.g., smoke or dust). ↵
- A colloid is a mixture in which one substance consisting of microscopically dispersed insoluble particles is suspended throughout another substance. ↵