30 Time-Dependent Flows
Introduction
In fluid dynamics and aerodynamics, a time-dependent or unsteady flow refers to the conditions where the properties (such as velocity, pressure, temperature, and density) at a particular point in space will change with time. This behavior contrasts with steady flow, where the fluid properties at a given point remain constant over time. Unsteady flows occur, and indeed are expected, in many real-world situations, such as when a fluid flow is subjected to changes in operating conditions, the initiation of transient events, or when time-varying external events produce non-steady forces on flows or flow systems.
In aerospace engineering, unsteady flow effects occur frequently. For example, they are found and must be considered to be able to predict the fluid behavior in the fields of aeroelasticity and flutter, rotating machinery, including jet engines and helicopter rotors, mixing processes, hydraulic and pneumatic control systems, and combustion processes in air-breathing and rocket engines. Analyzing and predicting unsteady flow can be more challenging than steady flow because it requires careful consideration of all relevant time-dependent factors. Closed-form solutions to most unsteady flow problems are generally only realizable in cases with specific assumptions. Therefore, experimental techniques and computational fluid dynamics (CFD) are often used to study unsteady flows in various engineering applications.
Learning Objectives
- Understand how to differentiate between steady and unsteady flows and recognize situations in which unsteady flow properties are relevant to problem-solving.
- Know about reduced frequency and Strouhal number and why they are essential for characterizing unsteady flows and the degree of unsteadiness.
- Be able to apply the conservation principles of fluid dynamics to solving some exemplar unsteady flow problems.
Classification of Time-Dependent Flows
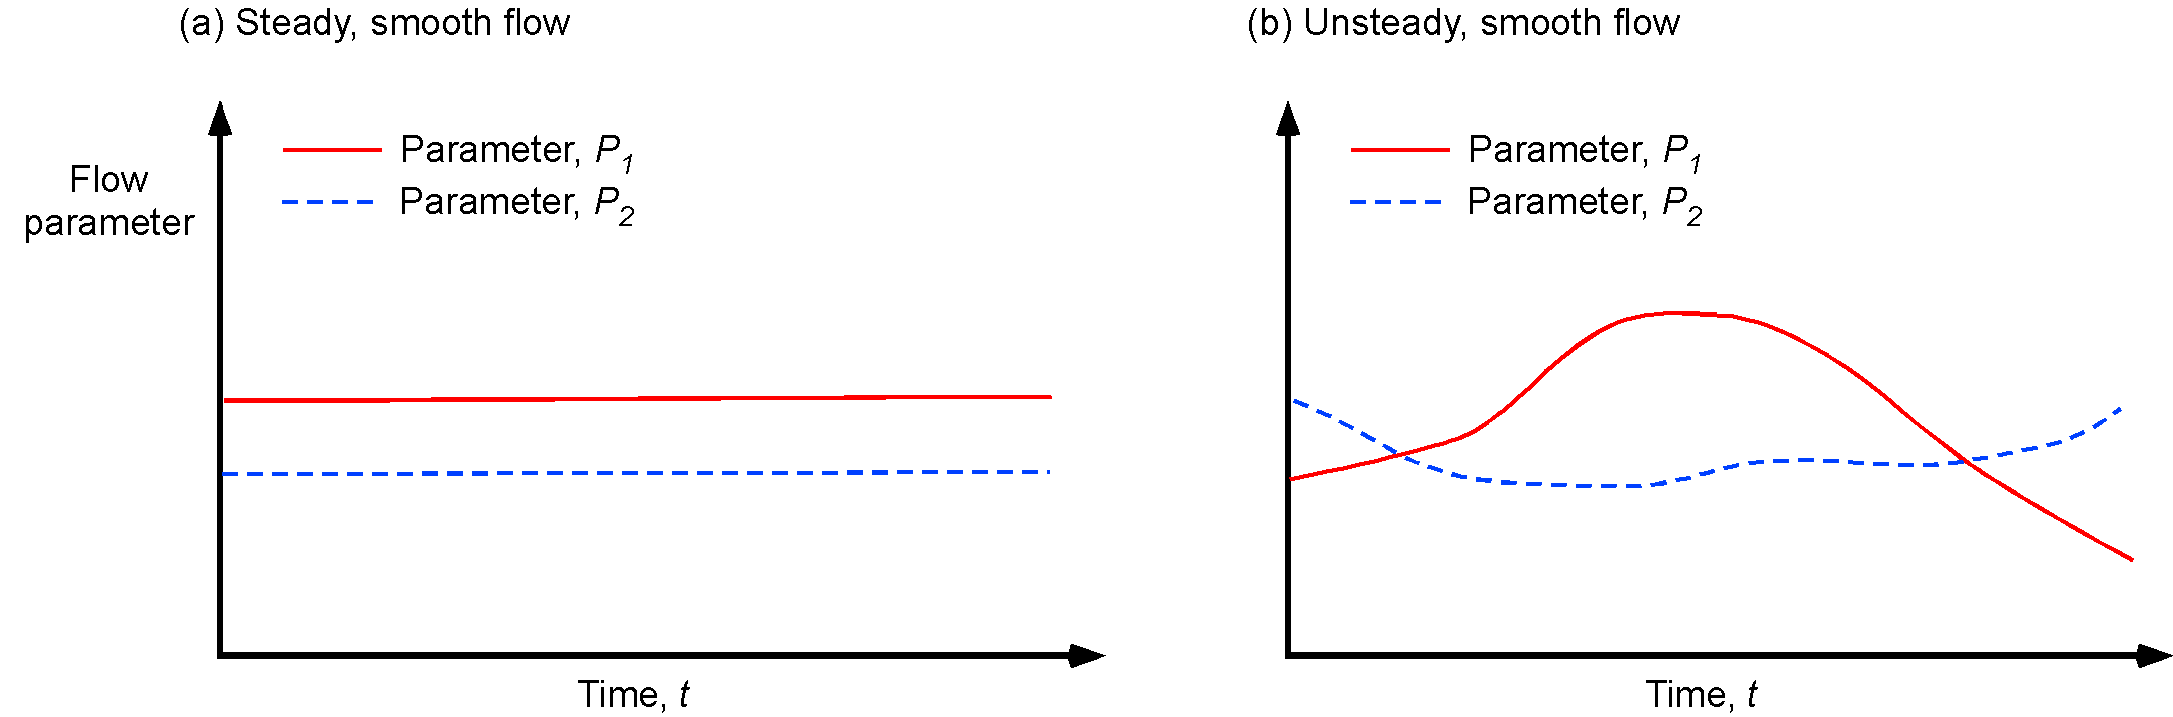
Steady flows are flows with properties that do not change as a function of time. A steady-state flow refers to the condition where the macroscopic flow properties, such as the velocity and pressure at a point, do not change with respect to time, as shown in the figure below on the left. Mathematically, for steady flows, then
(1) 
where  is any property such as pressure, temperature, velocity, density, etc. However, in a time-dependent flow, also known as an unsteady flow, the flow properties at a point will change in time, as shown in the figure below on the right. In this case, all of the unsteady terms in any equations used to describe the flow must be retained and solved, i.e.,
(2) 
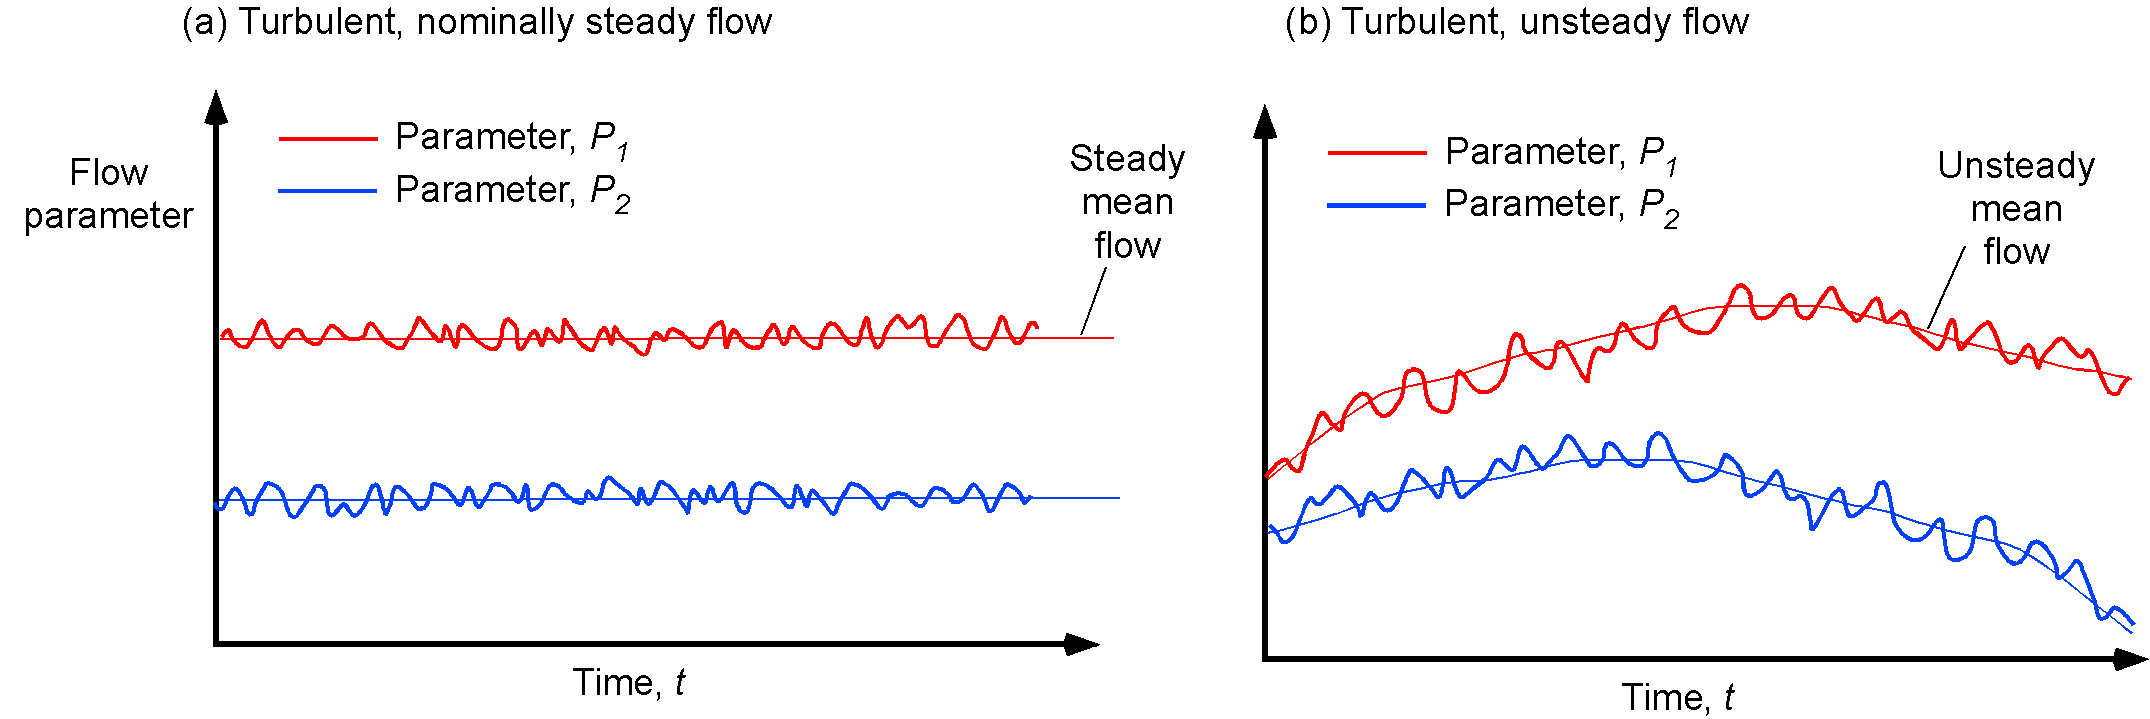
Unsteady flow phenomena are encountered in many engineering applications. Examples include the flows in turbomachinery and other internal combustion engines, helicopter aerodynamics, wind turbines, and numerous problems in aeroacoustics where creating time-varying aerodynamic loads produces sound (noise). A turbulent flow is an unsteady flow, by definition. However, a turbulent flow can still be statistically steady. This definition means that the average flow velocity and other quantities are constant with respect to time, and all the statistically varying properties, such as the fluctuating velocity component, are constant in time.
The figure below shows the difference between a statistically steady turbulent flow and a statistically unsteady flow. Turbulence enhances the mixing of fluids, promoting the transport of momentum, heat, and other properties within the fluid. The irregular motion of fluid particles makes it difficult to predict the behavior of the flow over time precisely; this randomness or mathematically stochastic behavior, is a fundamental characteristic of turbulence. However, statistically a flow property can be decomposed into a mean or average part,  , and a mean fluctuating part,
  , i.e.,
(3) 
This latter process is called a Reynolds decomposition, which is a helpful concept in modeling turbulent flows that will be explained later in this chapter.
One reason it is helpful to distinguish between steady and unsteady flows is that the former is often more tractable to understand and predict. Eliminating time from the solution of the equations that govern fluid flow problems usually results in a significant simplification of the governing equations as well as the mathematical and/or numerical techniques needed to solve these equations. Characterizing steady, quasi-steady, or unsteady flows is often done using parameters such as reduced frequency or Strouhal number.
Reduced Frequency
One parameter used to help categorize whether a flow is steady or unsteady is called the reduced frequency, given the symbols,  . The reduced frequency is defined as
(4) 
where  is a characteristic physical frequency of the unsteady flow,
  is a characteristic length scale, and
  is a reference flow velocity. For a wing or airfoil, such as one oscillating in angle of attack or an oscillatory vertical (heaving) motion as shown in the figure below, the reduced frequency is often defined in terms of its semi-chord, i.e.,
  , and the free-stream velocity, i.e., in this case it is defined as
(5) 

For = 0, the flow is steady, and all the usual aerodynamic results apply regarding the relationships between the aerodynamic quantities and the angle of attack. For 0  0.05, the flow can be considered quasi-steady; that is, unsteady effects are generally minor, and for some problems, they may be neglected completely. However, such reduced frequency bounds are subjective and not based on rigorous analysis.
In quasi-steady flows, the behavior can be evaluated by applying the principles of steady flow under the instantaneous boundary conditions of flow tangency to the airfoil surface. For example, for a thin airfoil, the changes in the angle of attack of a harmonically oscillating airfoil can be expressed as
(6) 
where  is the mean angle of attack and
  is the angle of attack amplitude of the oscillation. If the flow were quasi-steady, in the sense that flow adjustments were to take place instantaneously, the lift coefficient would be given by
(7) 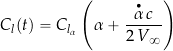
recognizing that the pitch rate, i.e.,  , must affect the lift coefficient because it changes the angle of attack. This equation then leads to
(8) 
where  is a frequency-dependent phase angle given by
(9) 
Therefore, even based on quasi-steady arguments, the lift response will no longer be in phase with the angle of attack (it will lead by the angle in this case) nor have the same amplitude (it is larger than  by a factor
  ). The upshot is that the aerodynamic forces will have different values depending on whether the angle of attack is increasing or decreasing with respect to time. The aerodynamics of oscillating airfoil sections and wings come up in the field of aeroelasticity and flutter, which are beyond the scope of this ebook.
Flows with characteristic reduced frequencies of 0.05 and above are usually considered unsteady, so all unsteady terms must be retained in the governing flow equations. Such problems are more challenging to determine for two reasons. First, the local flow properties also depend on the previous time, i.e., what has happened in the time history of the lift and other aerodynamic forces. Second, the effects of compressibility may be significant even if the free-stream flow velocity is low. This means that the time scales of the unsteady motion become of the order of propagating pressure disturbances in the flow, which occur at the speed of sound. Indeed, measurements suggest that the unsteady lift on an airfoil or wing is attenuated (diminished) by unsteady effects not amplified as the quasi-steady theory would suggest, and there is a lag (not a lead) in the aerodynamic response with respect to the angle of attack. These effects are formally embodied within the theory of unsteady aerodynamic behavior, for which extensive literature exists.
Strouhal Number
The Strouhal number, given the symbol  , is another dimensionless number used in fluid dynamics to characterize the behavior of oscillating or vibrating objects within a fluid flow. It is beneficial for analyzing phenomena such as vortex shedding and sound generation. The Strouhal number is defined as the ratio of the oscillation frequency to the product of the object’s characteristic length (or diameter) of the object and the velocity of the fluid. The equation is given by
(10) 
Notice that the physical frequency  (in Hz) determines the Strouhal number rather than the circular frequency in the reduced frequency. The Strouhal number is named after the Czech physicist and engineer Vincenc Strouhal, who significantly contributed to the study of oscillating flows in the late 19th and early 20th centuries.
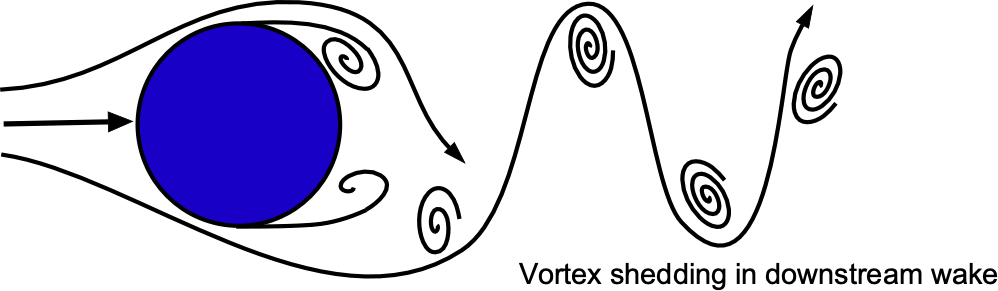
The Strouhal number is often used to analyze various fluid flow phenomena, such as the shedding of vortices behind a cylinder or another type of bluff (non-streamlined) body. It helps characterize the vortex shedding frequency relative to the fluid flow velocity and the object’s size. For different types of flows and body shapes, there are often characteristic Strouhal number ranges corresponding to specific flow regimes and behaviors, i.e., the behavior locks into a particular shedding frequency.
Worked Example #1 – Calculating the value of the Strouhal number
 of 0.1 m is immersed in a fluid flow with a velocity of 1.0 m/s. The shedding frequency of vortex shedding behind the cylinder is measured to be 2 Hz. What is the Strouhal number in this case?
The Strouhal number is defined by
![\[ St = \frac{f \, L}{V} \]](https://eaglepubs.erau.edu/app/uploads/quicklatex/quicklatex.com-90d73d76cf912fcc800d8d1862e18717_l3.png "Rendered by QuickLaTeX.com")
Using the numerical values gives
![\[ St = \frac{ 2.0 \times 0.1}{1.0} =0.2 \]](https://eaglepubs.erau.edu/app/uploads/quicklatex/quicklatex.com-e7b3de900076b94322f94f29a5b80d75_l3.png "Rendered by QuickLaTeX.com")
This value of 0.2 is often associated with the onset of vortex shedding behind a cylindrical object in a fluid flow. For example, suppose a particular combination of flow speeds and length scales results in a Strouhal number of 0.2. In that case, vortex shedding can be expected, and vortex-induced vibrations on a structure are possible. However, it is essential to note that specific Strouhal number values may vary for different flow conditions and other body shapes.
Time-Dependent Fluid Flows
Time-dependent flows are often more challenging to deal with in fluid dynamics but will apply the same principles of conservation of mass, momentum, and energy. An excellent way to learn how to solve unsteady flow problems is by studying the exemplars. In this regard, several classic exemplars in fluid dynamics can be used to lay down the solution principles when considering the additional dimension of time.
Liquid Draining from a Tank
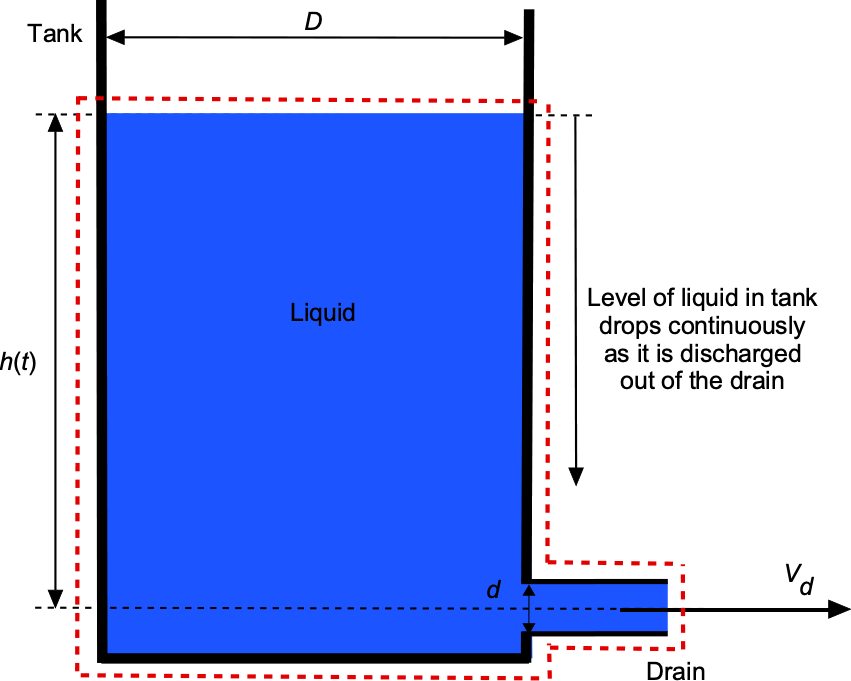
Consider the problem of a tank of circular cross-section that lets a liquid leave through a drain valve at the bottom, as shown below. The discharge velocity,  , of the flow from the drain varies with the height,
  , of the fluid level above the drain according to the relationship
  . The fluid is a liquid, so
  = constant. Notice that the height, , will decrease with time as the liquid leaves the tank.
The general form of the continuity equation is
(11) 
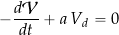
In this case, = constant so that it can be reduced to
(12) 
The volume of liquid  in the tank for any height is
(13) 
where  is the cross-sectional area of the tank, and
  is the area of the jet of liquid from the drain.
It is given that
(14) 
and this flow rate depends on the instantaneous height of the liquid in the tank, . This latter result is called Torricelli’s theorem, and it applies to a liquid that flows out of an orifice from the effects of a hydrostatic pressure head. Therefore, in a short time interval  , then the decrease in the volume of liquid in the tank will be
(15) 
where the minus sign denotes that decreases as the tank empties. Notice that the units in the preceding equation are in terms of a volume flow rate.
By continuity considerations (conservation of mass), this flow rate must be equal to the flow rate of liquid coming out of the drain, i.e., the problem is time-dependent, so
(16) 
where  is the flow rate. Therefore,
(17) 
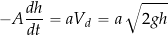
and the governing equation is
(18) 
Rearranging this equation gives
(19) 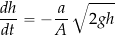
which is an ordinary differential equation relating the height of the level of the liquid to time.
Separating the variables and integrating them gives
(20) 
where the limits of integration are: At time  , then
  , and when
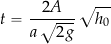
  , the tank is considered empty. Performing the integration gives
(21) 
In terms of the diameter of the tank,  , and the outlet diameter, , of the drain, then
(22) 
Therefore, the time required to empty the tank will be
(23) 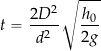
where  is the initial height of the liquid in the tank when the drain is first opened.
Filling an Air Tank
Consider now a rigid tank of volume  with air pumped into it at a constant mass flow rate, as shown in the figure below. In this problem, the effect of compressibility must be considered. Still, it can be assumed that the process is slow enough that it is isothermal, and the heat generated by compressing the air is dissipated through radiation by the tank.
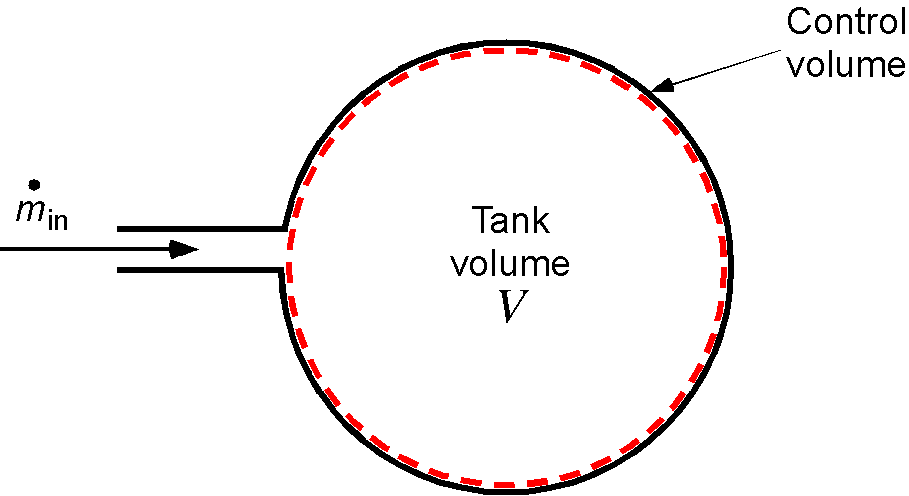
This is also an unsteady flow problem because a mass of air is pumped into a fixed volume, and for mass conservation, the air density must increase in time. The initial density and pressure are  and
and  , respectively. The general form of the continuity equation is
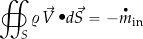
(24) 
so, in this case
(25) 
and so
(26) 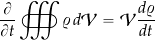
Assume a uniform mixing of air so the density inside the volume is uniform. Therefore,
(27) 
Integrating using the separation of variables gives
(28) 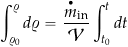
so that
(29) 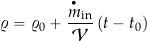
which shows that the density of the air increases linearly with time.
The corresponding pressure can be obtained from the equation of state, i.e.,  . If the process is assumed to be isothermal, then
  , and so
(30) 
Hydraulic Shock
Hydraulic shock, also known as “water hammer” or “hydraulic hammer,” is a time-dependent flow phenomenon that occurs in fluid flow systems, such as pipelines, when there is a sudden change in the flow velocity. This abrupt change can result in strong pressure waves propagating through the fluid, causing transitory surges in pressure inside the pipeline, as shown in the schematic below. Water hammer is common in fluid flow systems where valves and regulators are rapidly opened or closed.
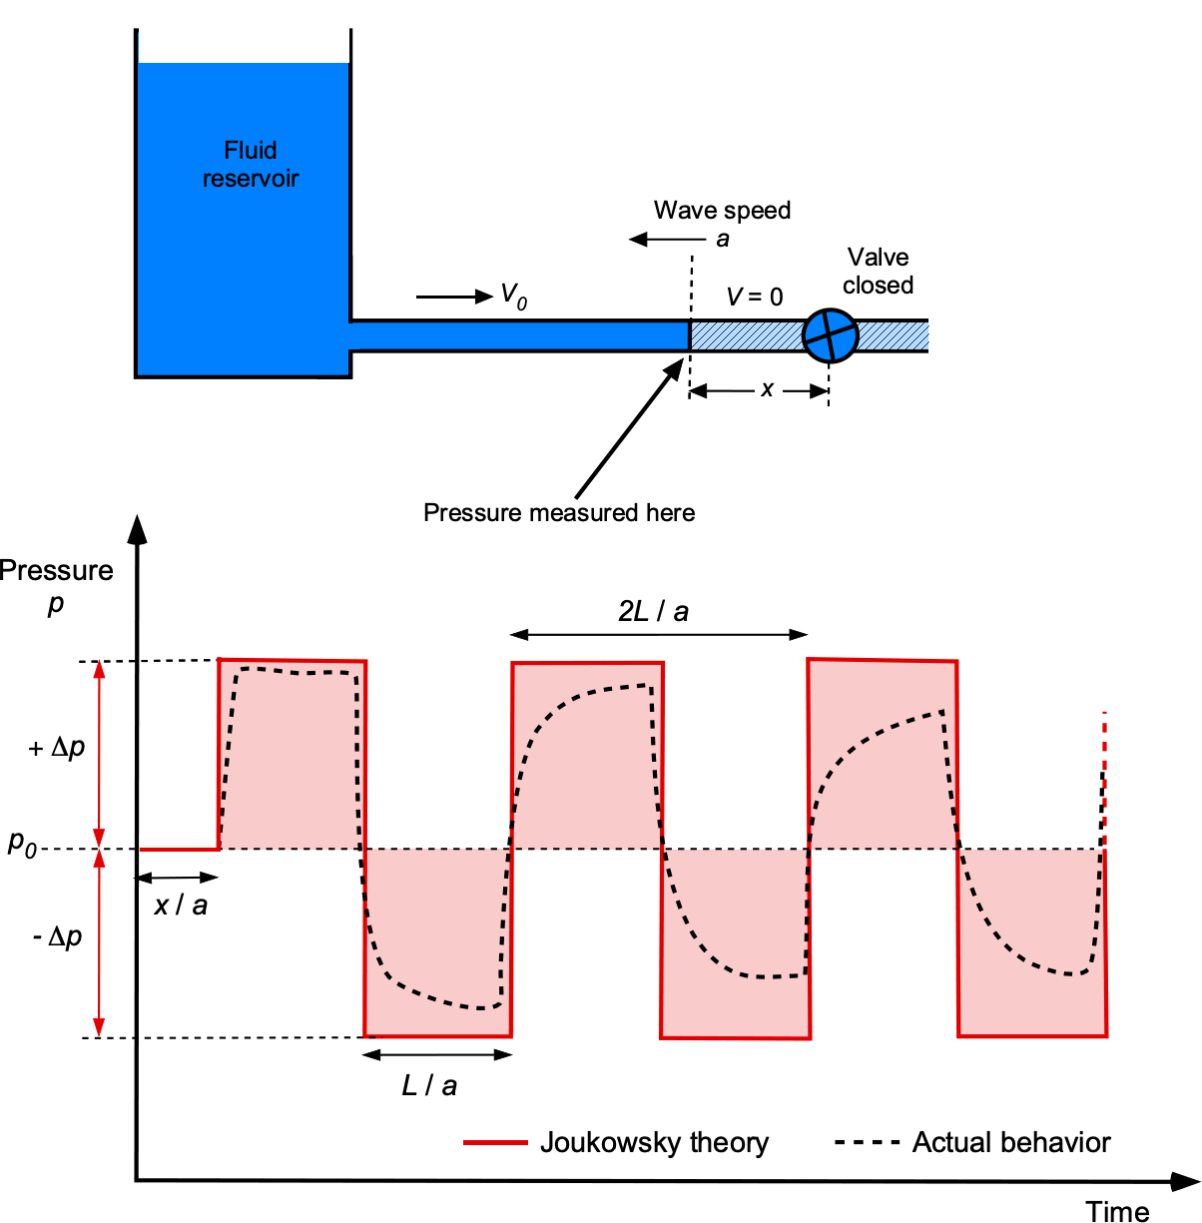
The fundamental cause of water hammer is the inertia of the fluid and the need for energy conservation when a sudden stoppage of the flow occurs. When a fluid is in motion and experiences a sudden change in velocity, its kinetic energy must be either absorbed or dissipated. If a valve is closed suddenly, the fluid comes to an abrupt stop, all kinetic energy is converted into pressure (or the equivalent in terms of pressure), and the flow stagnates in the pipe.
This process creates a pressure wave that travels back upstream through the pipe; this pressure wave travels through the fluid with speed, , known as the wave speed. When the pressure wave reaches the reservoir, the higher pressure head starts the flow downstream again, with continuing oscillations until the energy of the pressure wave is dissipated through frictional effects.
The resulting pressure pulses can be several times higher than the normal operating pressure. The change in pressure from the water hammer depends on how quickly the value is closed, the type of fluid, the length of the pipe, its elastic properties, and how the pipe is mounted, e.g., supported at its ends and/or clamped along its length. The rapid, time-dependent changes in pressure can generate loud banging or knocking sounds, often audible throughout the piping system.
Prolonged or severe water hammer can lead to structural damage to the pipes, their fittings, and other system components. The phenomenon can cause fatigue, leaks, and pipe bursts and accelerate the wear and tear on valves and pumps, increasing maintenance requirements. Preventing or mitigating water hammer effects involves engineering solutions and using various devices, such as surge tanks, air chambers, and water hammer arrestors, which are designed to absorb the excess pressure and prevent it from causing damage to the system.
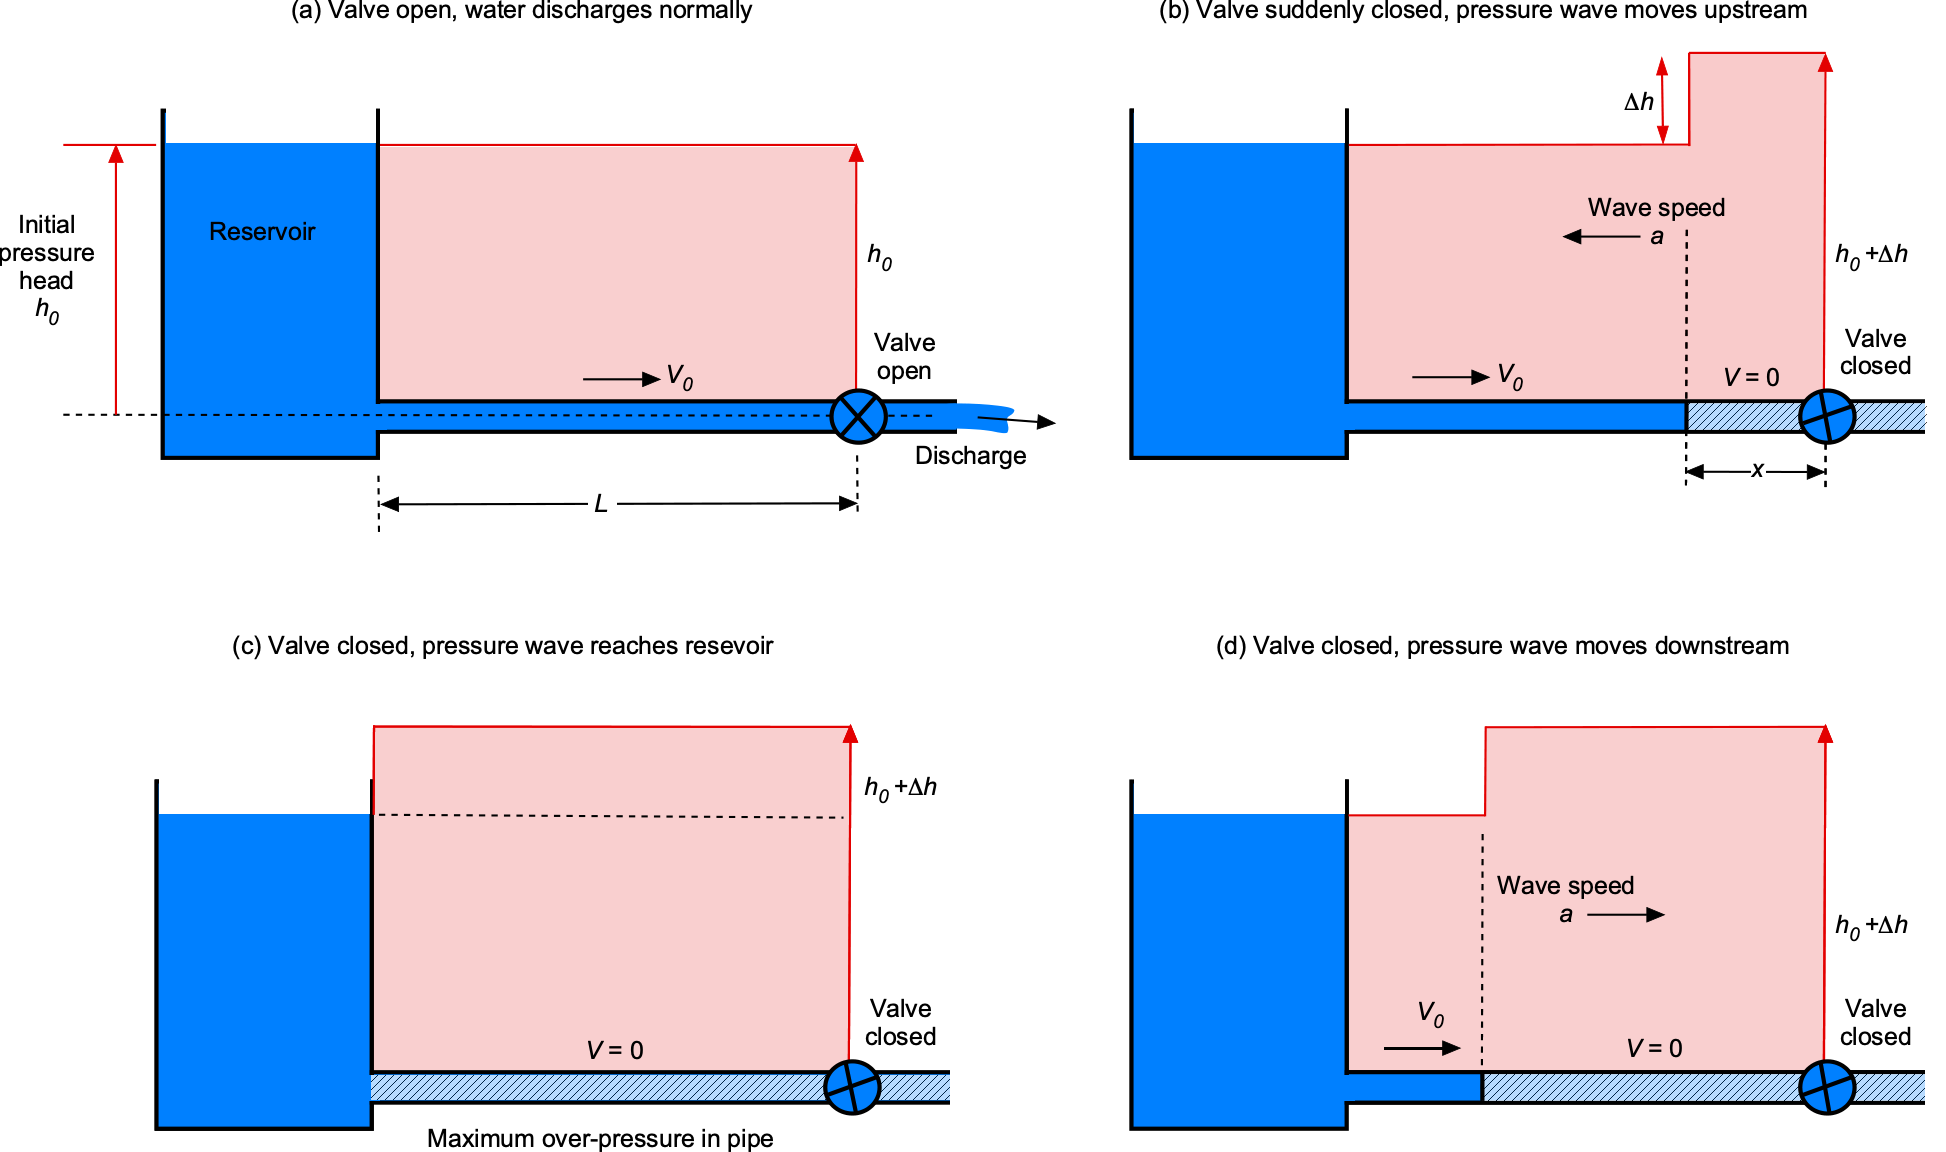
Consider the analysis of this problem. A liquid stored in a tank flows steadily through a pipe of length , as shown in the figure below. At the time , the valve at the downstream end is quickly closed, producing the classic pressure pulse of a water hammer. Water hammer transients are typically axisymmetric because the axial mass, momentum, and energy changes are significantly more significant than their radial counterparts.
Nikolay Joukowsky laid the foundation of the water hammer theory[1] where the pressure amplitude,  , in the liquid in the pipe is related to the change in flow velocity,
  , using
(31) 
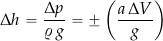
where  is the wave propagation speed (assumed to be constant) and is the density of the liquid; this equation is basically what is referred to today as piston theory. The negative sign in Eq. 31 describes a water hammer wave moving downstream, while the positive sign describes the wave moving upstream. Because pressure head is often used in the field of hydraulics, then Eq. 31 can also be written as
(32) 
There are three cases of interest when it comes to predicting water hammer effects, all of which involve the wave propagation speed:
- Gradual closure of the valve.
- Sudden closure of the valve.
- Closure of the valve allowing for the elasticity of the pipe, which will affect the wave propagation speed.
The transit time, also known as reflection time, taken for the pressure wave to propagate from the valve to the tank and then back to the valve will be
(33) 
If the time it takes to close the valve is  , then if
  is longer than the reflection time, the valve closure is considered gradual. If
  , which is shorter than the reflection time, then the valve closure is referred to as being sudden.
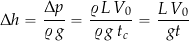
If , which is a gradual closure of the valve, then the increase in pressure from the water hammer is given by
(34) 
 is the average flow velocity inside the pipe before the valve closes. The equivalent pressure head of the water hammer is
(35) 
If  , which is a sudden closure of the valve, then the increase in pressure from the water hammer is given by
(36) 
and the equivalent pressure head is
(37) 
Notice that in both cases, the propagation speed of the pressure wave, , is needed. If the pipe is rigid, then
(38) 
where  is called the bulk modulus of the liquid, for which values for various liquids are available. This latter equation is often referred to as the Newton-Laplace equation.
If the pipe is elastic, for which most will be to a lesser or greater degree, then
(39) 
where  is called the effective bulk modulus of the liquid in the pipe. The value of can be obtained using
(40) 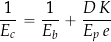
where  is the modulus of elasticity of the pipe, is the pipe diameter, and
  is the wall thickness of the pipe. The value of
  depends on exactly how the pipe is mounted and anchored; usually
  . The modulus of elasticity of the pipe is a material property for which values are also widely available.
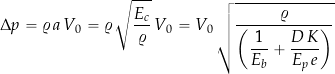
Finally, consider the valve’s sudden closure when the pipe’s elasticity is considered. In this case
(41) 
Worked Example #2 – Determining hydraulic shock pressure in a pipeline
A steel pipe that is 1,000 ft long has a 15-inch diameter and a 1.5-inch wall thickness. The pipe carries water from a reservoir, and a valve is located downstream. When the valve is fully open, the flow rate through the pipe is 23.3 ft /s. If the valve is closed completely in 0.15 seconds, determine the water hammer pressure in the pipe. Assume = 3.0
  lb/in
lb/in , and = 2.8
  lb/in, and = 1.0. The density of water is 1.94 slugs/ft
 .
.
The relevant equation, in this case, for the water hammer pressure in an elastic pipe is
![\[ \Delta p = \varrho \, a \, V_0 = \varrho \sqrt{ \frac{E_c}{\varrho} } V_0 \]](https://eaglepubs.erau.edu/app/uploads/quicklatex/quicklatex.com-99a0955843e346d36c724bddbb945ed3_l3.png "Rendered by QuickLaTeX.com")
where is the effective bulk modulus of the water in the pipe. The average velocity through the pipe, , is related to flow rate, , using
![\[ V_0 = \frac{Q}{A} = \frac{4 Q}{\pi \, D^2} = \frac{4 \times 23.3}{\pi (15.0/12.0)^2} = 18.99~\mbox{ft/s} \]](https://eaglepubs.erau.edu/app/uploads/quicklatex/quicklatex.com-397c374df73eb0c1dd413bd50320101a_l3.png "Rendered by QuickLaTeX.com")
The effective bulk modulus is given by
![\[ \frac{1}{E_c} = \frac{1}{E_b} + \frac{D \, K}{E_p \, e} = \frac{1}{3.0 \times 10^5} + \frac{(15.0/12.0) \times 1.0}{2.8 \times 10^7 \times (2.0/12.)} = 3.75 \times 10^{-6} \]](https://eaglepubs.erau.edu/app/uploads/quicklatex/quicklatex.com-1ed28401c16df350908e32fba72a6fd2_l3.png "Rendered by QuickLaTeX.com")
so that the value of is  lb/in
lb/in . Therefore, the wave propagation speed is
![\[ a = \sqrt{ \frac{E_c}{\varrho} } = \sqrt{ \frac{144 \times 2.67 \times 10^5}{1.94} } = 4,451.8~\mbox{ft/s} \]](https://eaglepubs.erau.edu/app/uploads/quicklatex/quicklatex.com-1ea1d781fa4af6e1bccd1e8eec42d213_l3.png "Rendered by QuickLaTeX.com")
and the wave reflection time is
![\[ t_t = \frac{2 L}{a} = \frac{2 \times 1,000}{4,451.8} = 0.45~\mbox{s} \]](https://eaglepubs.erau.edu/app/uploads/quicklatex/quicklatex.com-9e7927262dfaa58310bbadbd328c66a4_l3.png "Rendered by QuickLaTeX.com")
And so with a valve closure time of 0.15 s, then  , this is a sudden closure. Therefore, the water hammer change in pressure will be
![\[ \Delta p = \varrho \, V_0 \, a = 1.94 \times 18.99 \times 4,451.8 = 1.64 \times 10^5~\mbox{lb/ft$^2$} = 1,138.94~\mbox{lb/in$^2$} \]](https://eaglepubs.erau.edu/app/uploads/quicklatex/quicklatex.com-de1797595056e20ba8beca6e137d2107_l3.png "Rendered by QuickLaTeX.com")
Why is the speed of sound so much higher in a liquid than in air?
The speed of sound in a medium, whether it’s a gas, liquid, or solid, depends on the properties of that medium. Sound is faster in liquids and solids than in gases because the molecules in liquids and solids are much closer together, allowing for more rapid transmission of mechanical waves. The speed of sound in a medium is determined by its density and elastic properties, specifically its bulk modulus. The bulk modulus measures a substance’s resistance to compression or expansion when subjected to pressure. Liquids and solids generally have higher bulk moduli than gases, making them less compressible. In a liquid, the molecules are closer together than in a gas, and they can still transmit mechanical waves. This closeness of molecules and the resistance to compression contribute to a higher sound speed in liquids than in gases.
Producing Jet Thrust
A monopropellant thruster is a very basic rocket, often used for satellite propulsion and control, with the propellant stored in a pressurized storage tank. The propellant is released over time by opening the valve to flow over a catalyst bed, causing thermal decomposition and the liberation of energy from the propellant, as shown in the figure below. The flow then expands through a nozzle to produce an exit velocity and, hence, a thrust from the time rate of change of momentum of the expanding gases. The idea is that the thrust boosts the satellite to change its orbital velocity and altitude.
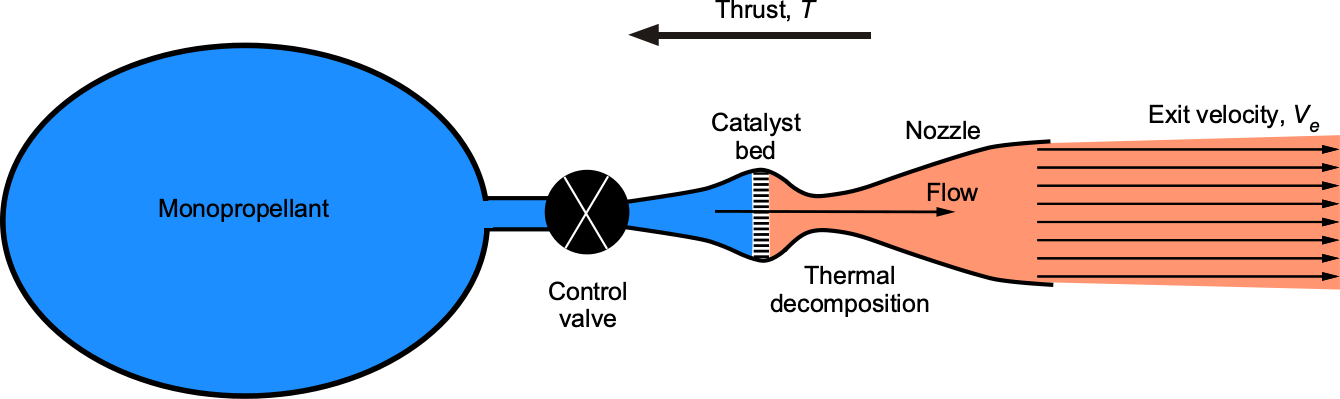
This is a time-varying flow problem because a mass of fluid (propellant) is continuously discharged from a tank, so the mass of propellant inside the control volume is decreasing. The most general form of the continuity equation is
(42) 
and in this case, it can be reduced to
(43) 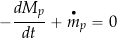
where  is the mass of the propellant and
  is the propellant flow rate. Notice that the minus sign occurs because the total propellant mass is decreasing.
Let the initial mass of the spacecraft be  . Conservation of mass gives the current mass of the spacecraft,
  , at time
  later as the propellant is discharged as
(44) 
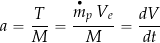
where = constant. The thrust force from the propulsion system is given by Newton’s second law (force equals time rate of change of momentum), i.e.,
(45) 
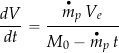
and so the acceleration of the spacecraft, which is not constant because of its continuously decreasing mass, is given by
(46) 
Therefore,
(47) 
Integrating the equation gives
(48) 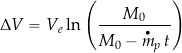
which has a special name called the rocket equation.
Worked Example #3 – Discharge of a monopropellant thruster
An orbiting satellite is propelled using a monopropellant thruster. The satellite has an initial mass of 5,000 kg, including its propellant mass. To give a slight corrective boost to its orbit, it opens the control valve and ejects the propellant at a constant rate of 0.1 kg/s at an effective exit velocity of 2,000 m/s. Assume that the satellite operates in a vacuum and no gravity forces are acting on it. Determine the thrust, the change in velocity of the satellite, and the new mass after 90 seconds from the start of the propulsive burn.
The thrust produced can be determined from the time rate of change of momentum of the exhaust gases, i.e.,
![\[ T = \overbigdot{m}_p \, V_e = 0.1 \times 2,000 = 200~\mbox{N} \]](https://eaglepubs.erau.edu/app/uploads/quicklatex/quicklatex.com-b5cdbbf5512942613e6250ca3f5747d6_l3.png "Rendered by QuickLaTeX.com")
After 90 seconds of thrusting, i.e., = 90, then using the rocket equation gives
![\[ \Delta V = 2,000 \ln \left( \frac{5,000}{5,000 - 0.1 \times 90.0 } \right) = 3.6~\mbox{m/s} \]](https://eaglepubs.erau.edu/app/uploads/quicklatex/quicklatex.com-b0e9aaa6bf9a8ca95f2c6ddedca3bf37_l3.png "Rendered by QuickLaTeX.com")
The final mass after the burn will be
![\[ M = M_0 -\overbigdot{m}_p \, t = 5,000 - 0.1 \times 90 = 4,991~\mbox{kg} \]](https://eaglepubs.erau.edu/app/uploads/quicklatex/quicklatex.com-27091d4a0a69ad20419d595c368af27e_l3.png "Rendered by QuickLaTeX.com")
Unsteady (Dynamic) Stall
Under unsteady conditions, airfoils and wings behave differently than in steady flow. In particular, their stall characteristics are very different, and the behavior is called a dynamic stall. This phenomenon has received much research interest because of the unsteady aerodynamic effects produced, which include the shedding of a leading-edge vortex, as shown in the simulation below.
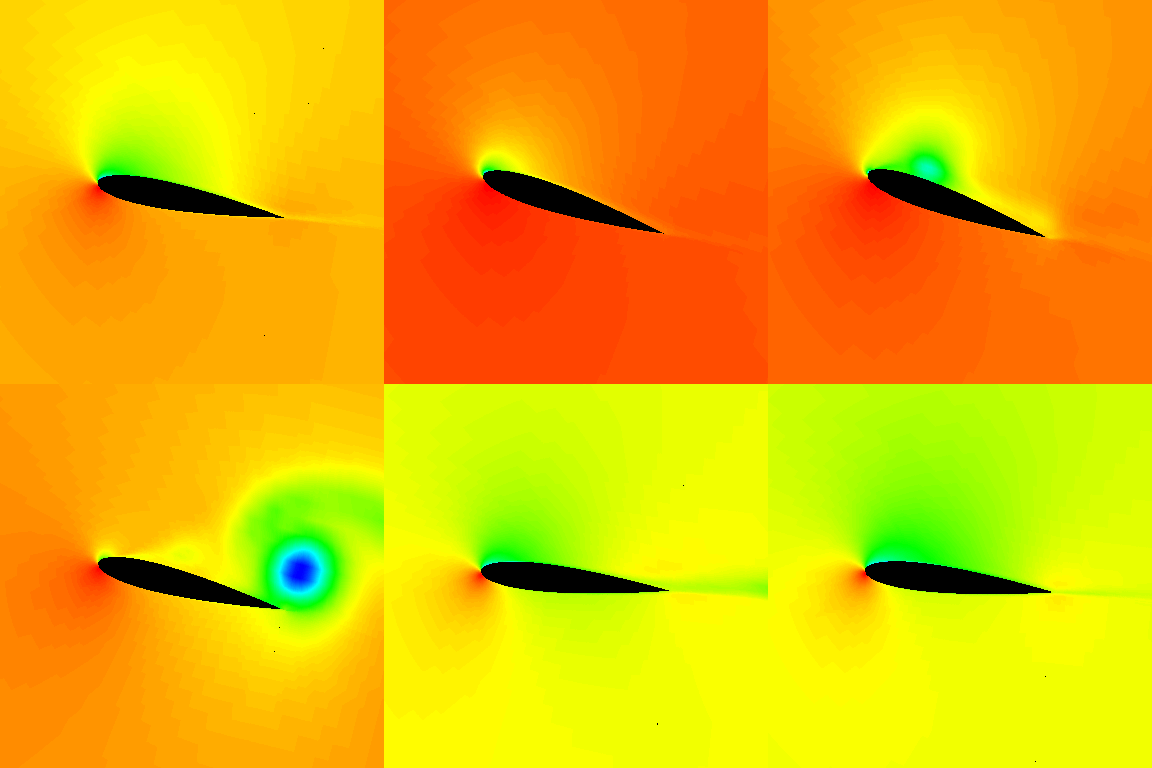
The vortex shedding increases lift and drag, giving powerful nose-down (negative) pitching moments because of the aft-moving center of pressure induced by the shedding vortex, as shown in the figure below, based on measurements and flow visualization. Dynamic stall is known for exhibiting higher levels of maximum lift, drag, and pitching moments and hysteresis effects that can lead to flutter phenomena. Dynamic stall is particularly relevant in designing and analyzing helicopter rotors, wind turbine blades, and specific aircraft configurations.
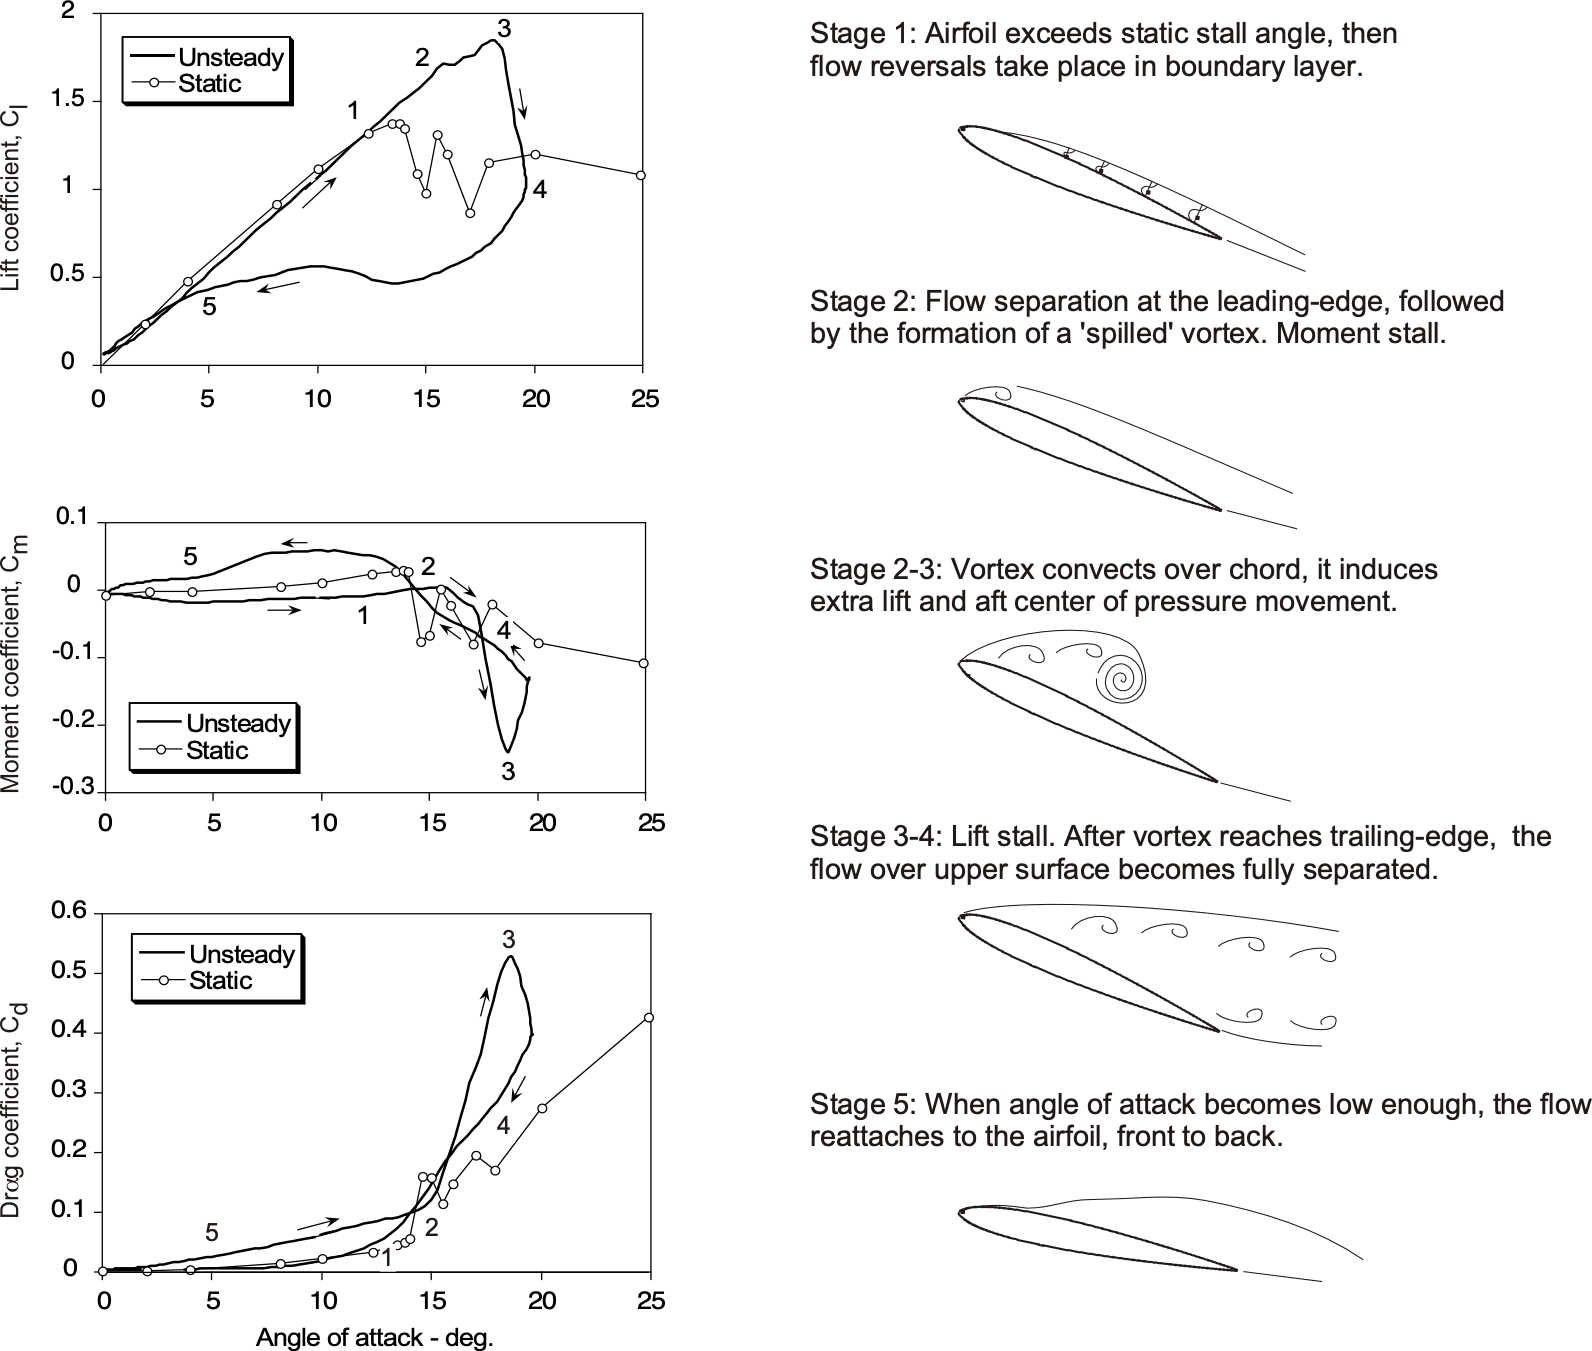
Engineers and researchers study the phenomenon of dynamic stall to understand the effects better and develop strategies to mitigate any adverse impact on the performance of aerospace systems. In particular, helicopter rotor blades often experience dynamic stall during higher-speed forward flight or during maneuvers. Indeed, the onset of dynamic stall limits the helicopter’s operational flight envelope. Wind turbine blades may encounter dynamic stall during sudden changes in wind conditions, leading to variations in power output and high blade loads that may produce concerning vibration levels. Aircraft wings can also undergo dynamic stall during aggressive maneuvers, which is a behavior that must be considered in establishing the maneuvering flight envelope for military combat aircraft.
Summary & Closure
Unsteady flows occur whenever fluid properties fluctuate with respect to time. Understanding unsteady flows is crucial in various engineering and scientific disciplines, as they tend to be more prevalent in real-world problems. The practical implications of unsteady flows extend to advanced aerodynamic design and propulsion systems, necessitating advanced mathematical models and computational methods. Being able to categorize an unsteady flow is the first step in its analysis, which can often be quantified using a reduced frequency parameter. This chapter has shown that learning how to solve unsteady flow problems by following some classic exemplars helps expose the solution principles when considering the dimension of time.
5-Question Self-Assessment Quickquiz
For Further Thought or Discussion
- Can you provide real-world situations where unsteady flow is crucial in fluid systems or engineering applications?
- Why is reduced frequency an essential parameter for analyzing fluid flow oscillatory or vibratory motion?
- In what scenarios might the Strouhal number be a relevant parameter to consider?
- How does turbulence contribute to the complexity of fluid dynamics, and why is it often associated with unsteadiness?
- Discuss the practical implications of unsteady flows in engineering design. How might engineers account for unsteady conditions in the design of systems like pipelines, aircraft, or water turbines?
- How might unsteady flows impact the efficiency and performance of propulsion systems, such as those in aircraft or marine vehicles?
Other Useful Online Resources
To learn more about unsteady flows, take a look at some of these online resources:
- A good video explaining the differences between steady and unsteady flows.
- An explanation of unsteady flows, including the effects of thermodynamics.
- An explanation of the conservation of mass in unsteady flow.
- A video presentation on the application of the continuity equation to unsteady flows.
- Joukowsky, N. (1898). “Über den hydraulischen Stoss in Wasserleitungsröhren.” (“On the hydraulic hammer in water supply pipes.”) Mémoires de l'Académie Impériale des Sciences de St.-Pétersbourg (1900), Series 8, 9(5), 1-71 (in German). ↵